Amazon Price History Tools for Checking and Tracking Product Prices
At AMZScout, we focus on delivering accurate insights and powerful tools to help Amazon sellers make informed decisions. All the information we share comes from reliable sources and reflects the latest developments in the Amazon marketplace.
Prices on Amazon fluctuate constantly. Numerous factors contribute to price fluctuations, including peak sales periods such as Prime Day and Black Friday, seasonal variations, shifts in the market landscape, and the impact of holidays, among others. In this ever-changing landscape, monitoring price trends becomes a must-have strategy for both sellers and consumers.
Table of contents
Why Is It Important to Check Price Changes?
Examining a product's price history on Amazon is crucial for both buyers and sellers.
For customers, it helps them identify true discounts, allowing them to determine whether a deal is genuine or just a marketing tactic. Understanding price fluctuations can help buyers time their purchases, avoid impulse buying, and manage their budget effectively.
For sellers, analyzing price history is a crucial component of the product research process because it provides invaluable insights into competitors’ pricing strategies and broader market trends. This information enables you to assess a product's profitability, which allows for a more nuanced approach to mitigating the risks associated with dynamic pricing strategies.
But how can you keep track of these price changes without the hassle of combing through so many product pages every day? Here are some efficient methods to help you streamline this task.
How to See Price History on Amazon
There are a number of apps you can use to track prices on Amazon. We’ve featured three tools here that will give you the pricing information you need to make an informed decision:
1. AMZScout PRO AI Extension
The AMZScout PRO AI Extension is a Google Chrome extension that allows you to see all sorts of in-depth insights on any product sold on Amazon’s website.
Here’s how to use the PRO AI Extension to view a product’s price history:
1. Install the AMZScout PRO AI Extension (available on a free trial).
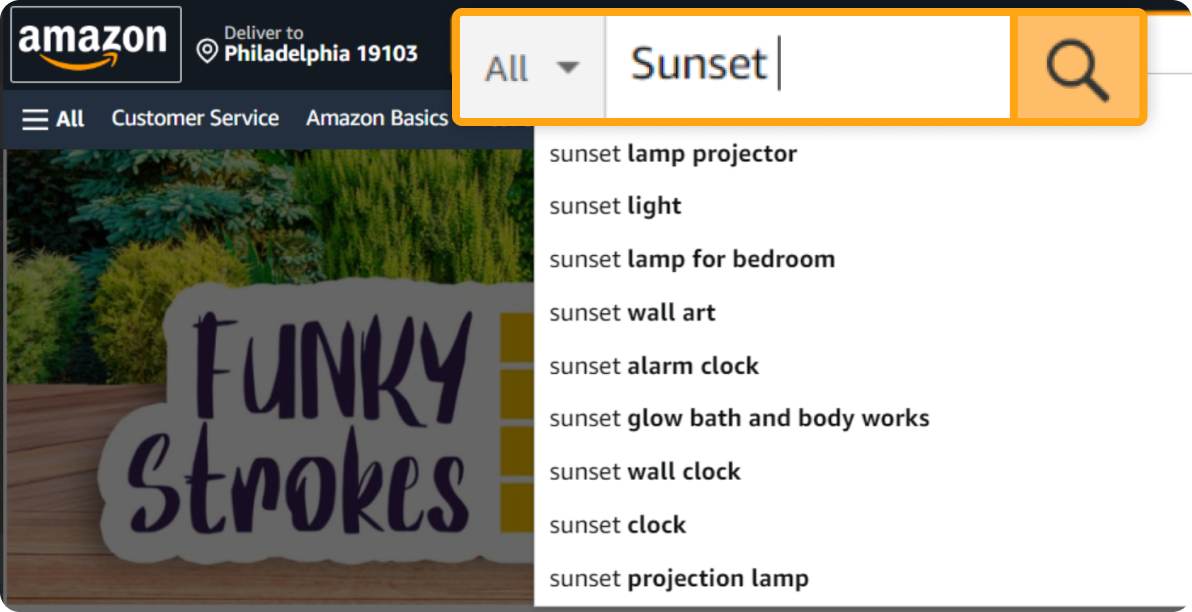
2. Search for a product or niche on the Amazon website.
3. Open the tool. When the results come up, click on the PRO AI Extension icon in the top right corner of your browser.
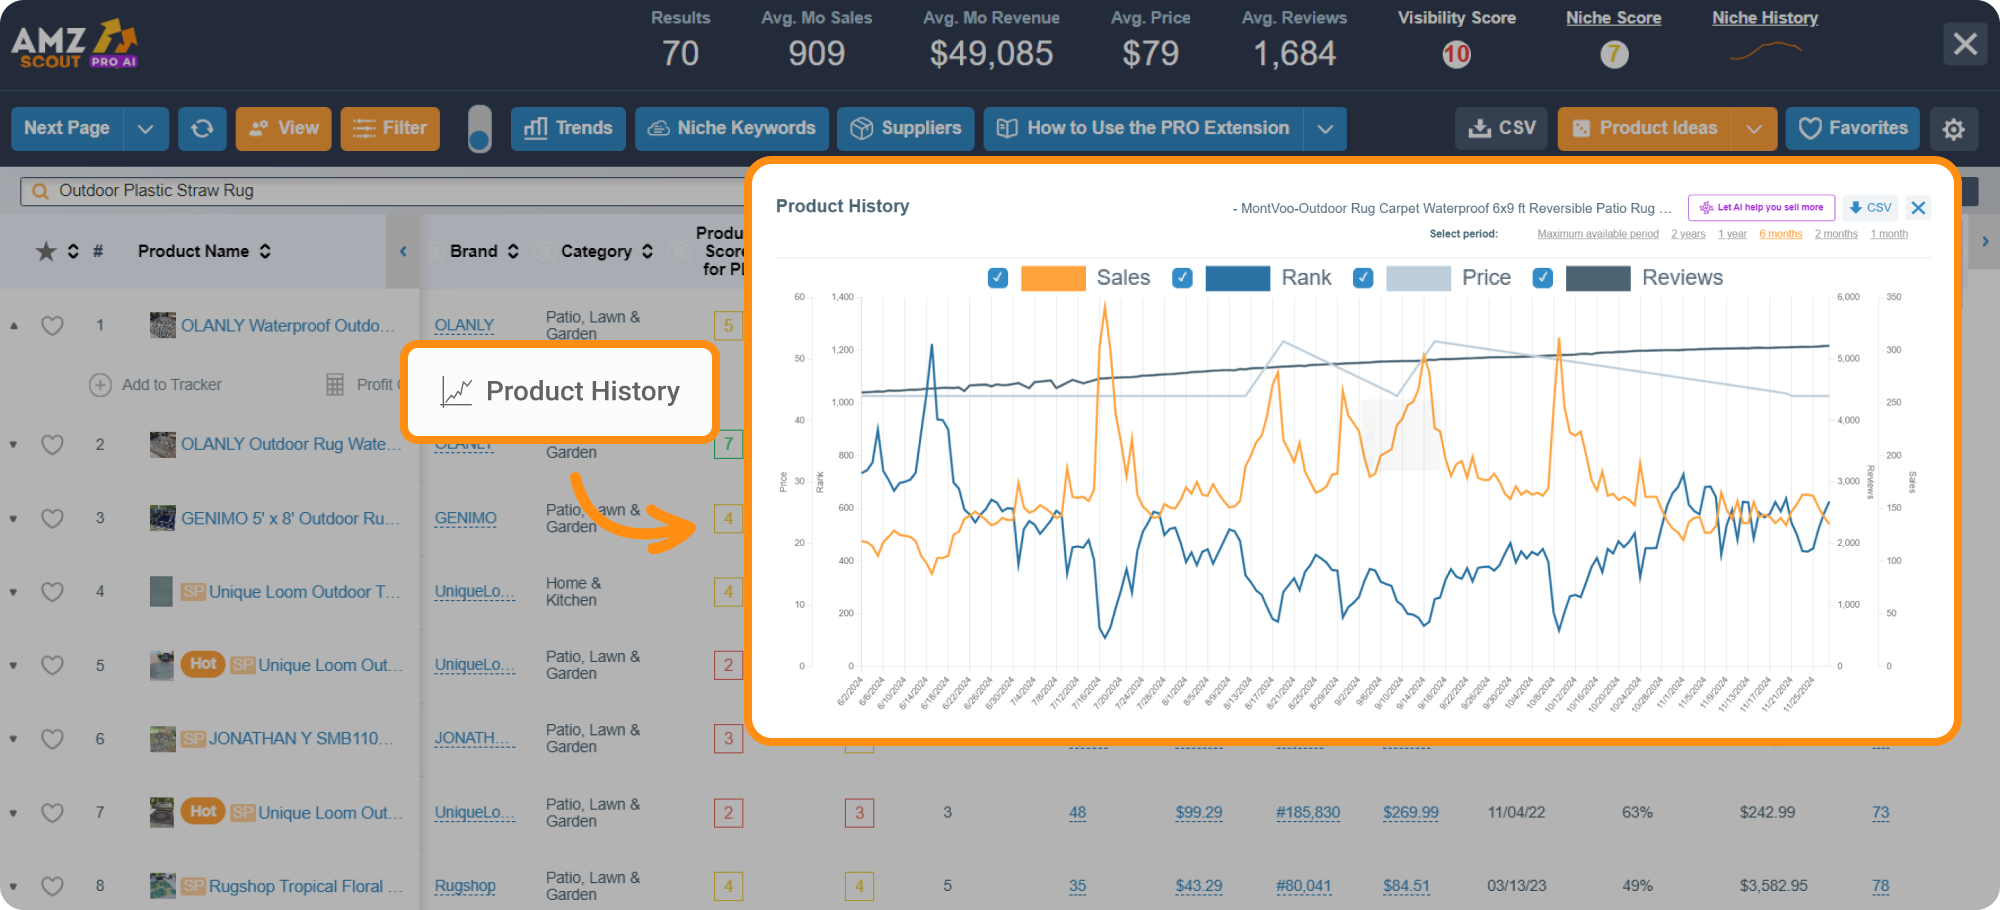
4. Review the dashboard. All of the products that appeared in your search will now be listed in the PRO AI Extension, along with metrics like rank, price, FBA fees, net margin, estimated sales, reviews, and more.
5. Check the Amazon price history. Click on the arrow next to a product, open the dropdown menu, and then click Product History. This will bring up a graph that displays the sales, rank, and price of the product over the last two years.
6. Review the data chart. The grey line indicates the price. Move your mouse over the graph to see the exact price for a specific date.
It’s also a good idea to review the price history of any item you’re thinking of selling on Amazon. Ideally, you want to find a product with a fairly consistent price. This tells you that:
The price is unlikely to experience a significant sudden drop. If it does, this could harm your profit margins.
The product isn’t too competitive. Numerous price fluctuations often mean merchants are fighting for the lowest price.
This item maintains steady sales throughout the year. If you observe price decreases during specific times of the year, it's probably a seasonal product.
By reviewing a product’s price history, you can identify consistent pricing, avoid investing in overly competitive products, and spot seasonal fluctuations. Below, we’ll share two more useful tools that can help you analyze vital information on product prices and more.
2. Product Database
The AMZScout Product Database is a powerful search tool that helps you generate product ideas. It includes a number of filters, such as sales, reviews, price, weight, and more to help you narrow your search and look up items that meet your strict criteria. It also includes a price history feature for any product you find with the tool.
Here’s how to use the Product Database to view an item’s price history:
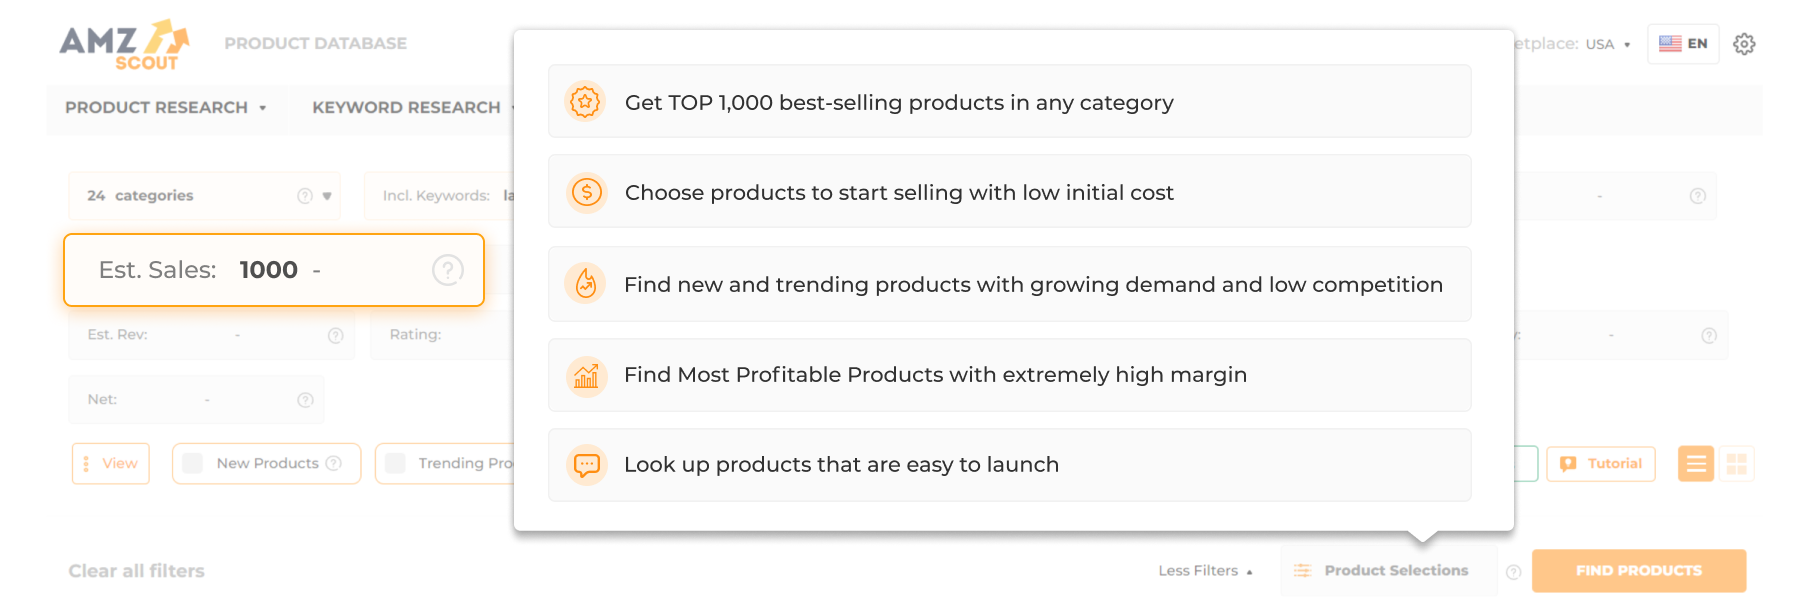
Set filters. Enter your search criteria for the products you would like to check. These criteria may include minimum/maximum monthly sales, reviews, price range, or weight. If you need inspiration, you can also utilize the Product Selections feature.
Click on "Find Products" to initiate your search. Your results will be displayed below.
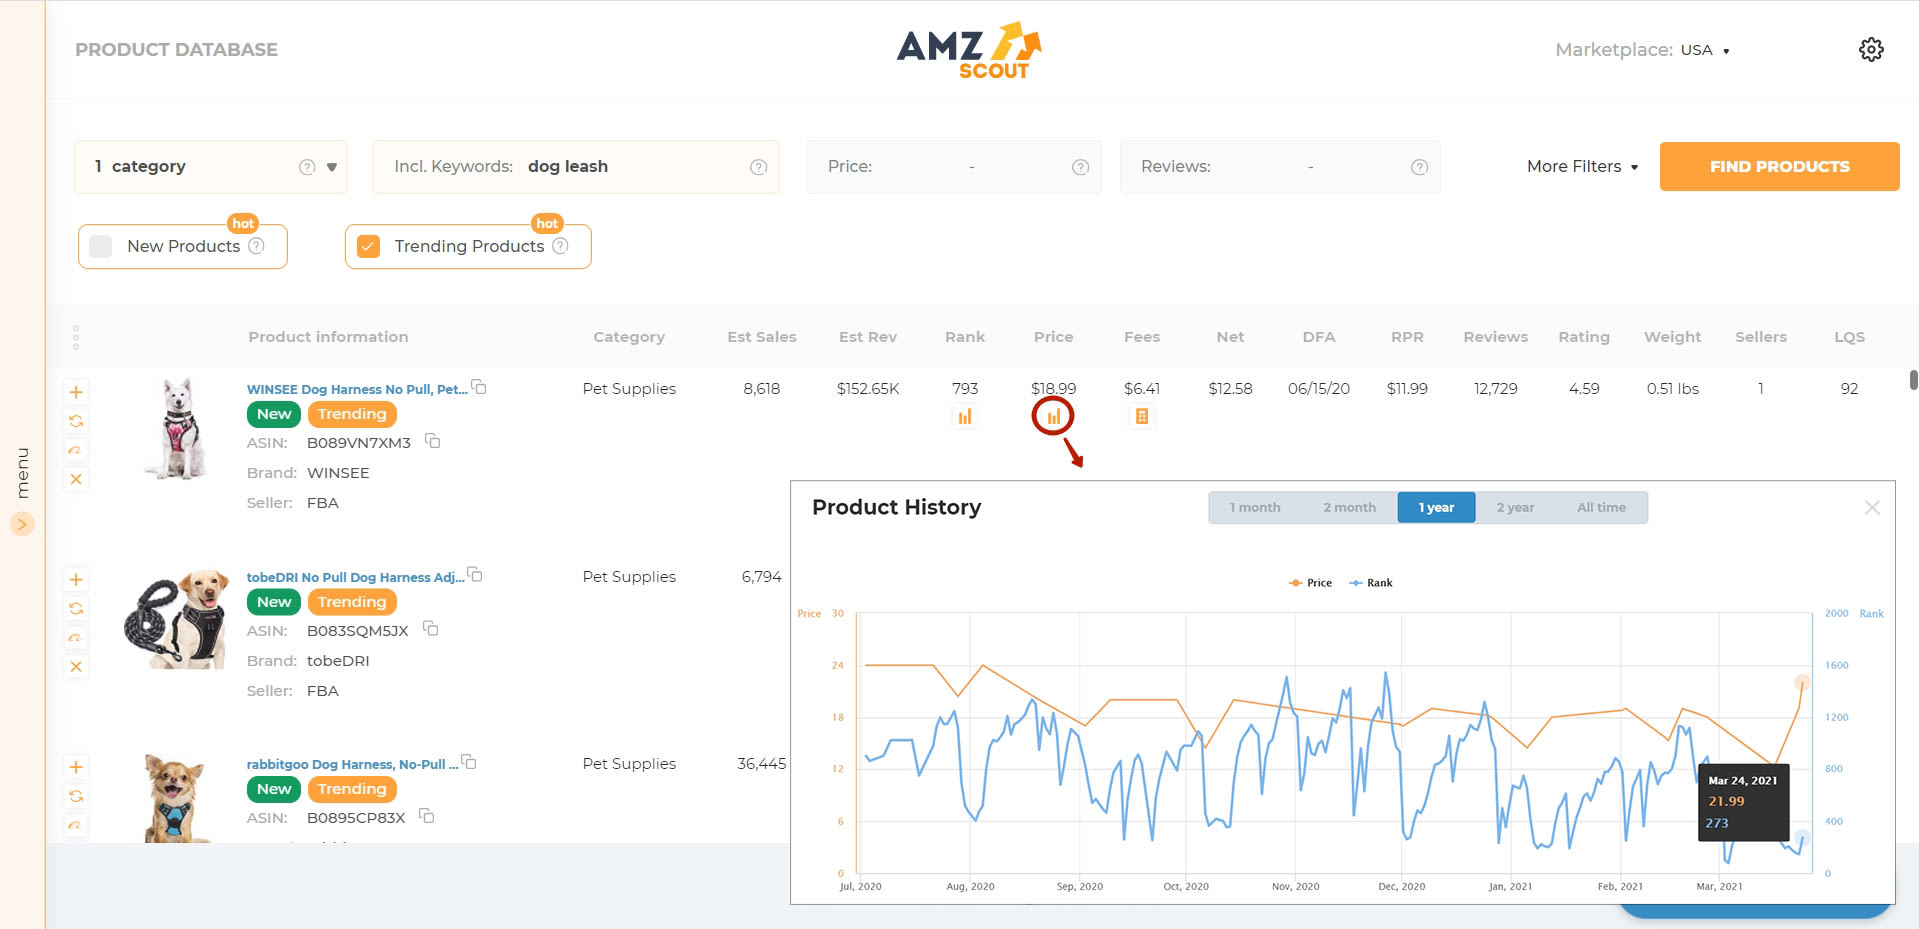
Select the product you are interested in and click the chart icon located beneath the price.
Analyze the pricing data. This chart will show you the item’s price and rank, with the price represented by the yellow line. You can adjust the timeframe to one month, two months, one year, two years, or all time.
For the most information, click “All-Time” to see the product’s price history over its entire lifespan. This will let you see how the price has changed year to year and if there are certain seasons that result in more sales.
3. Amazon Dropshipping, Arbitrage, and Wholesale
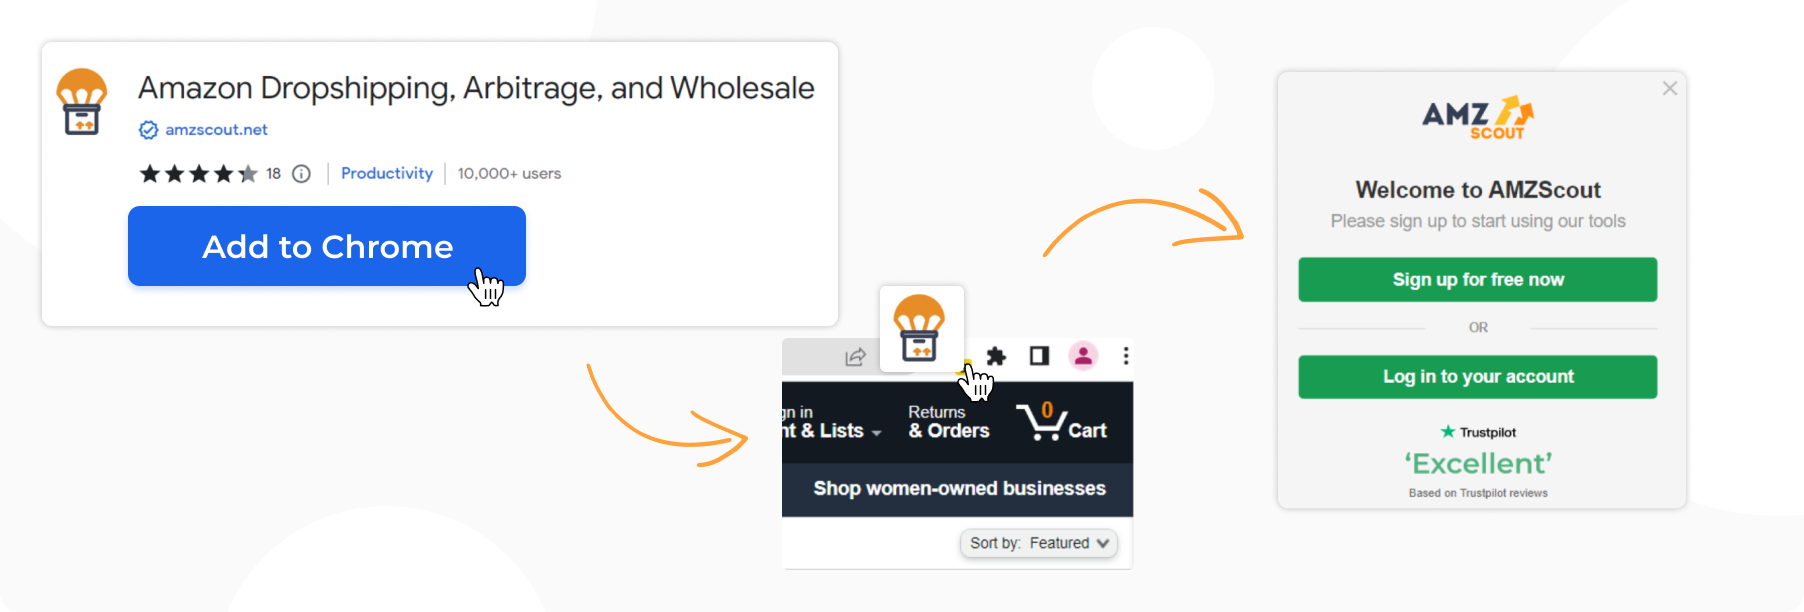
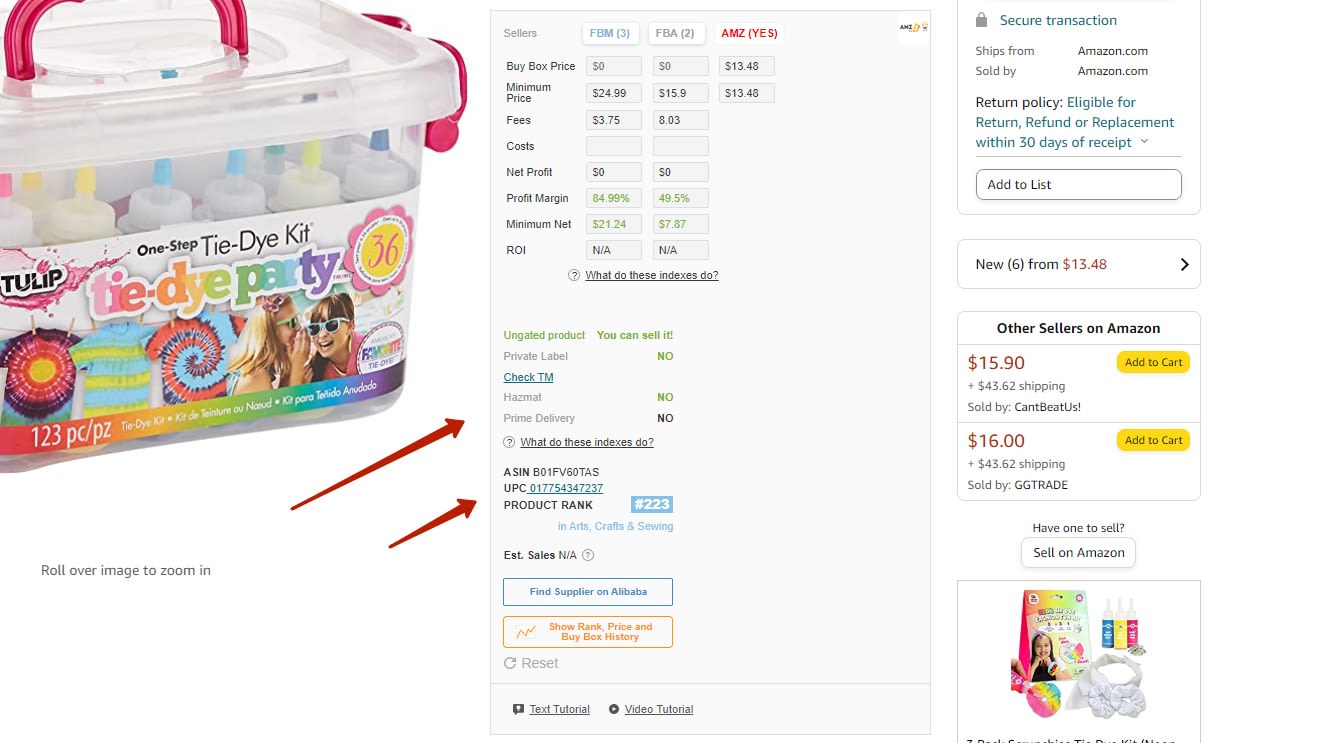
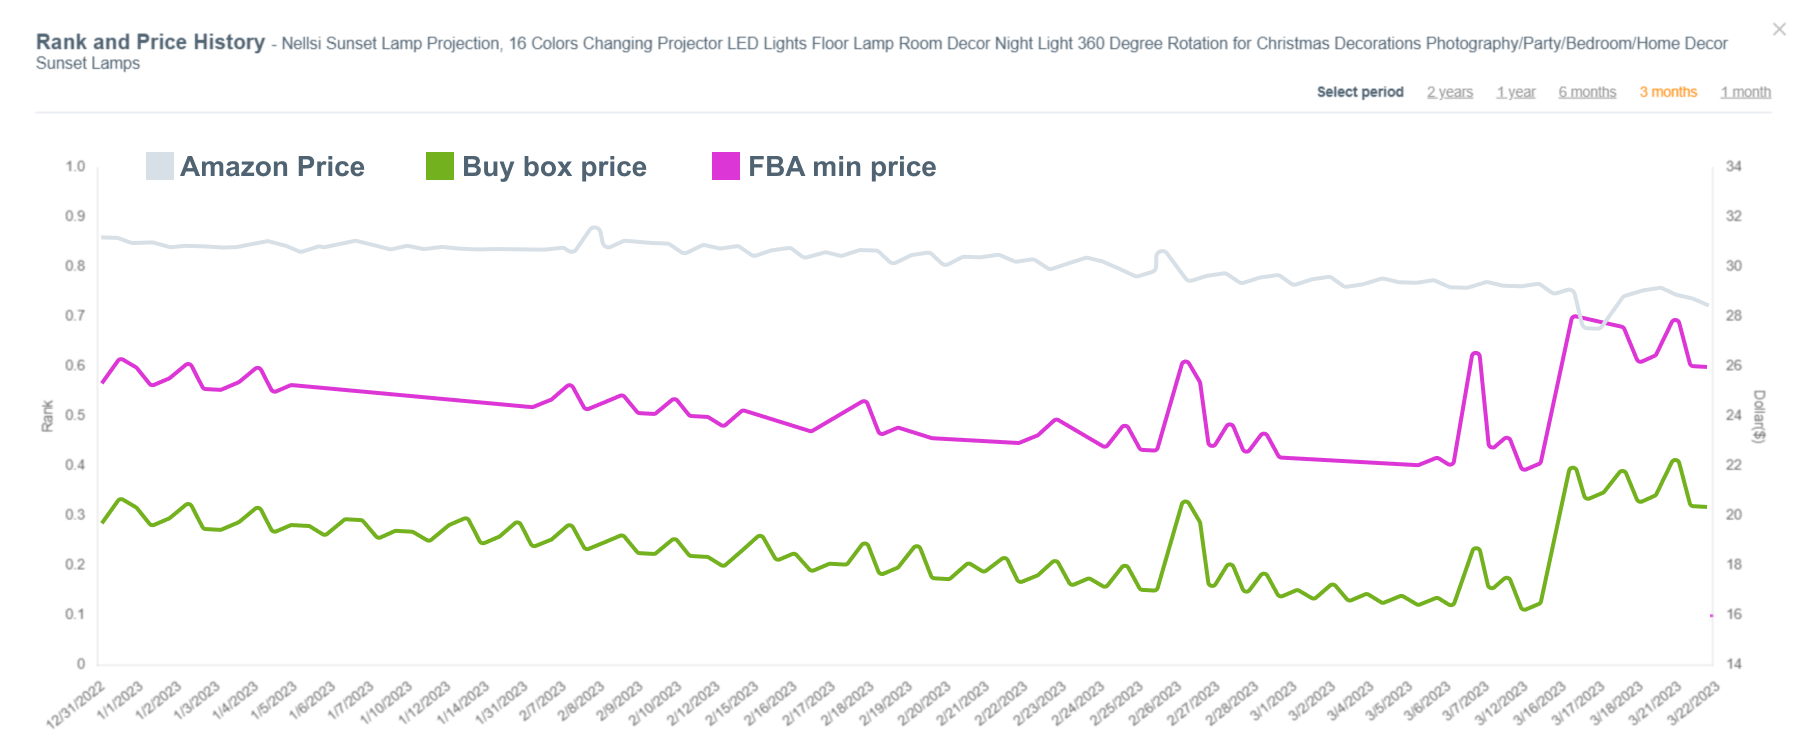
Another valuable tool for tracking an item's price history is the AMZScout Amazon Dropshipping, Arbitrage, and Wholesale extension. Similar to the popular Camelcamelcamel extension, this tool offers much more detailed insights, and allows you to check the Buy Box price, Amazon price, FBA and FBM minimums, while also providing metrics such as sales, rank, and even calculating potential product profits.
Here's a step-by-step guide on how to use the extension to view an item's price history:
Install the AMZScout Amazon Dropshipping, Arbitrage, and Wholesale extension.
Open Amazon and search for the product you wish to check.
Go to the product page where you will see a window adjacent to the product listing.
Click the "Show Rank, Price and Buy Box History" button to view the chart.
Analyze the data. The graph displays the item's rank and price, with different colored lines representing various prices. You can select timeframes of one month, two months, one year, two years, and all-time.
This tool can assist you in analyzing price variations when you are planning to resell products and developing a smart pricing strategy.
4. Camelcamelcamel & Keepa
If you need a simple way to only check prices, you can use free tools like Camelcamelcamel or Keepa - just keep in mind that they come with some limitations.
Camelcamelcamel: This browser-based tool lets you paste an Amazon product link or search directly on their site. It generates charts showing historical pricing trends, tracks third-party seller prices, and allows you to set email alerts when prices drop. The main drawback is limited functionality: its interface is basic, and data updates can sometimes lag, making it less reliable for real-time tracking.
Keepa: Keepa is available both as a website and as a browser extension. Once installed, it integrates directly into Amazon product pages, adding a price history chart beneath the listing. Keepa provides more granular insights than Camelcamelcamel, such as Amazon vs. third-party seller prices and Buy Box changes. However, its free version restricts some features, and full access requires a paid subscription.
While these tools are useful for quick checks and casual shoppers, sellers or serious buyers may find the limitations, such as partial data coverage, slow refresh rates, and fewer advanced filters, a significant drawback compared to professional solutions.
5. Price History on Amazon Itself
Reddit users note that Amazon has been quietly testing a built-in price history tool in recent years, which appeared for some users during Prime Day promotions. When available, this feature shows a small chart directly on the product page, often under the product price or near the discount information. The chart displays how the item’s price has changed over time, giving a quick overview without needing third-party apps.
However, there are notable drawbacks:
Inconsistent availability: Many users reported the feature appearing temporarily and then disappearing, suggesting Amazon is still experimenting.
Limited detail: The charts are very basic, showing only a few data points without the in-depth breakdowns found in dedicated tools like AMZScout.
Testing phase: Since Amazon hasn’t officially announced this feature, there’s no guarantee it will roll out permanently.
If it becomes a standard part of the shopping experience, Amazon’s own tracker could be very convenient. For now, though, relying solely on it isn’t advisable since it may or may not show up on your product searches.
Products Showing Genuine Price Decreases in 2025
Both customers and sellers can take advantage of price drops—whether as a smart shopping tactic or a sourcing strategy. Below are five examples of products that are currently experiencing significant price decreases:
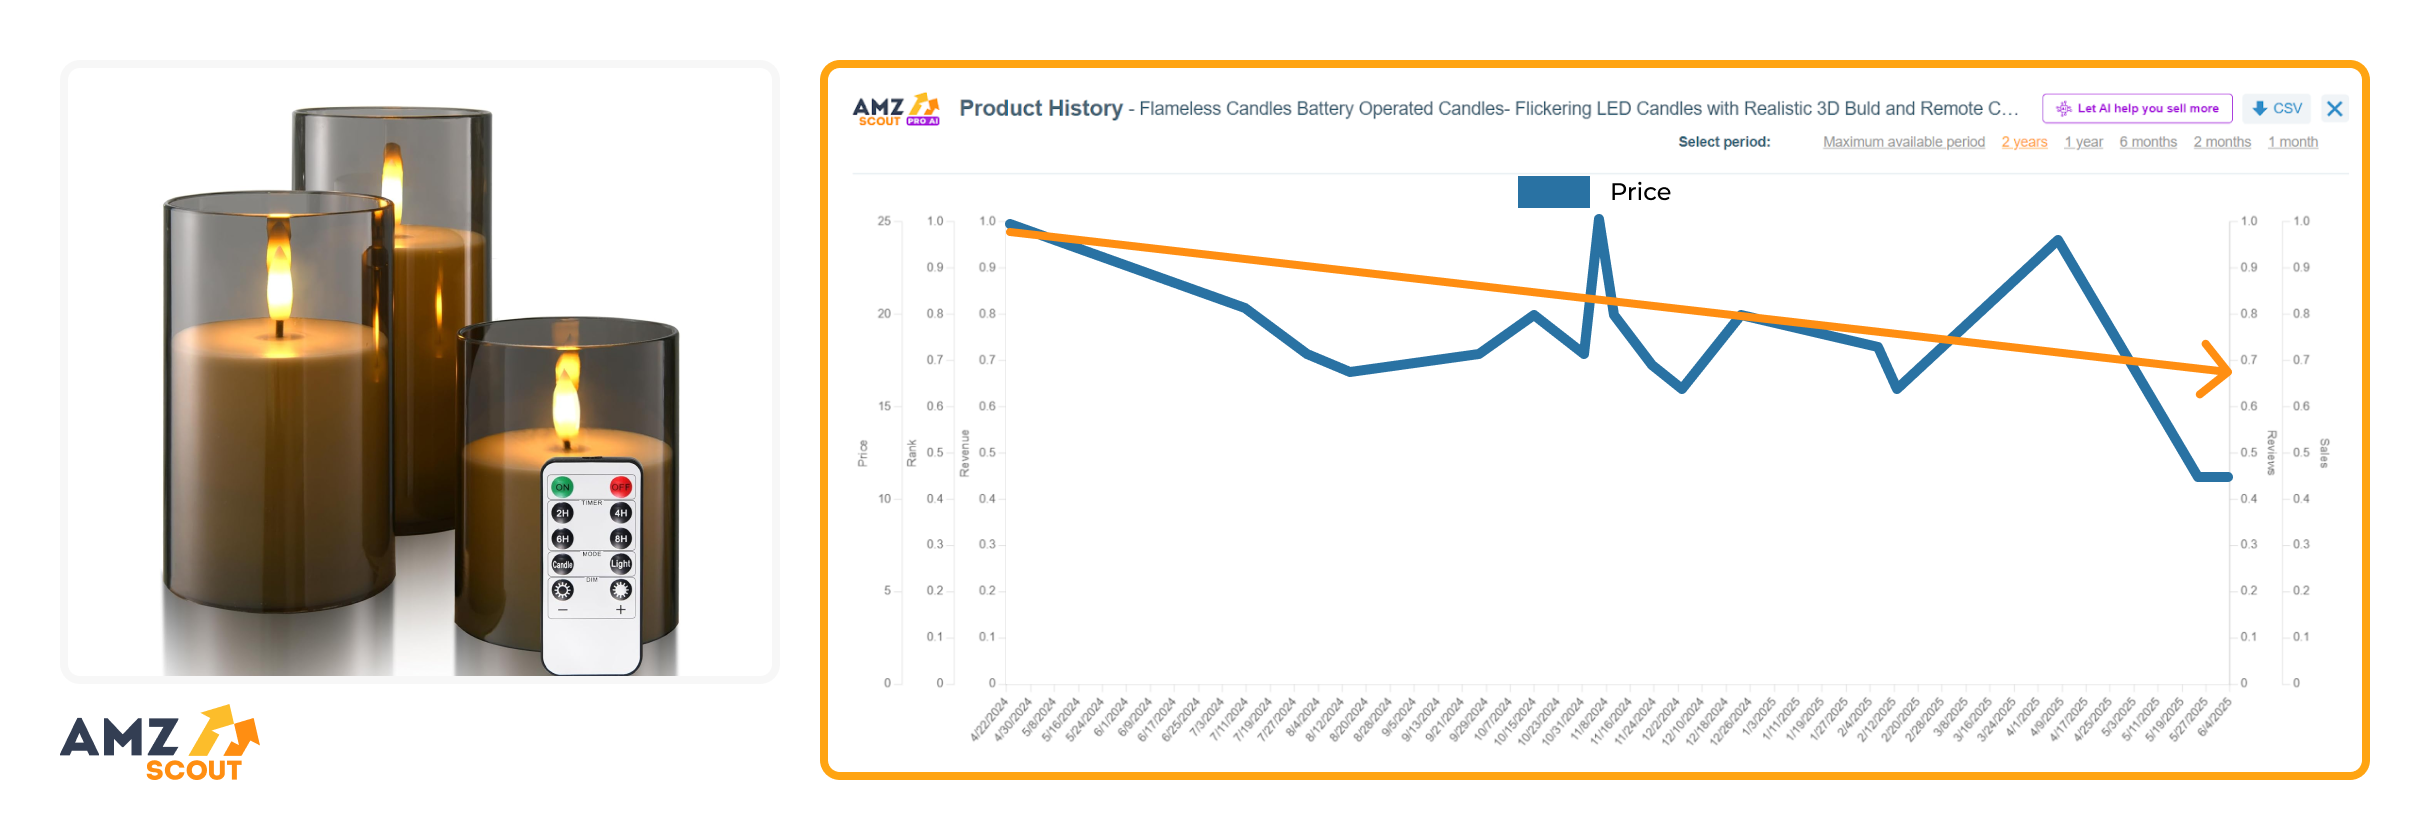
1. Flameless Candles
According to AMZScout PRO AI, the prices of flameless candles drop by $10 during the spring months. These prices typically peak at $20 or higher during the winter holiday season, while the lower spring prices may be due to this product’s association with Christmas décor, making this a good off-season opportunity.
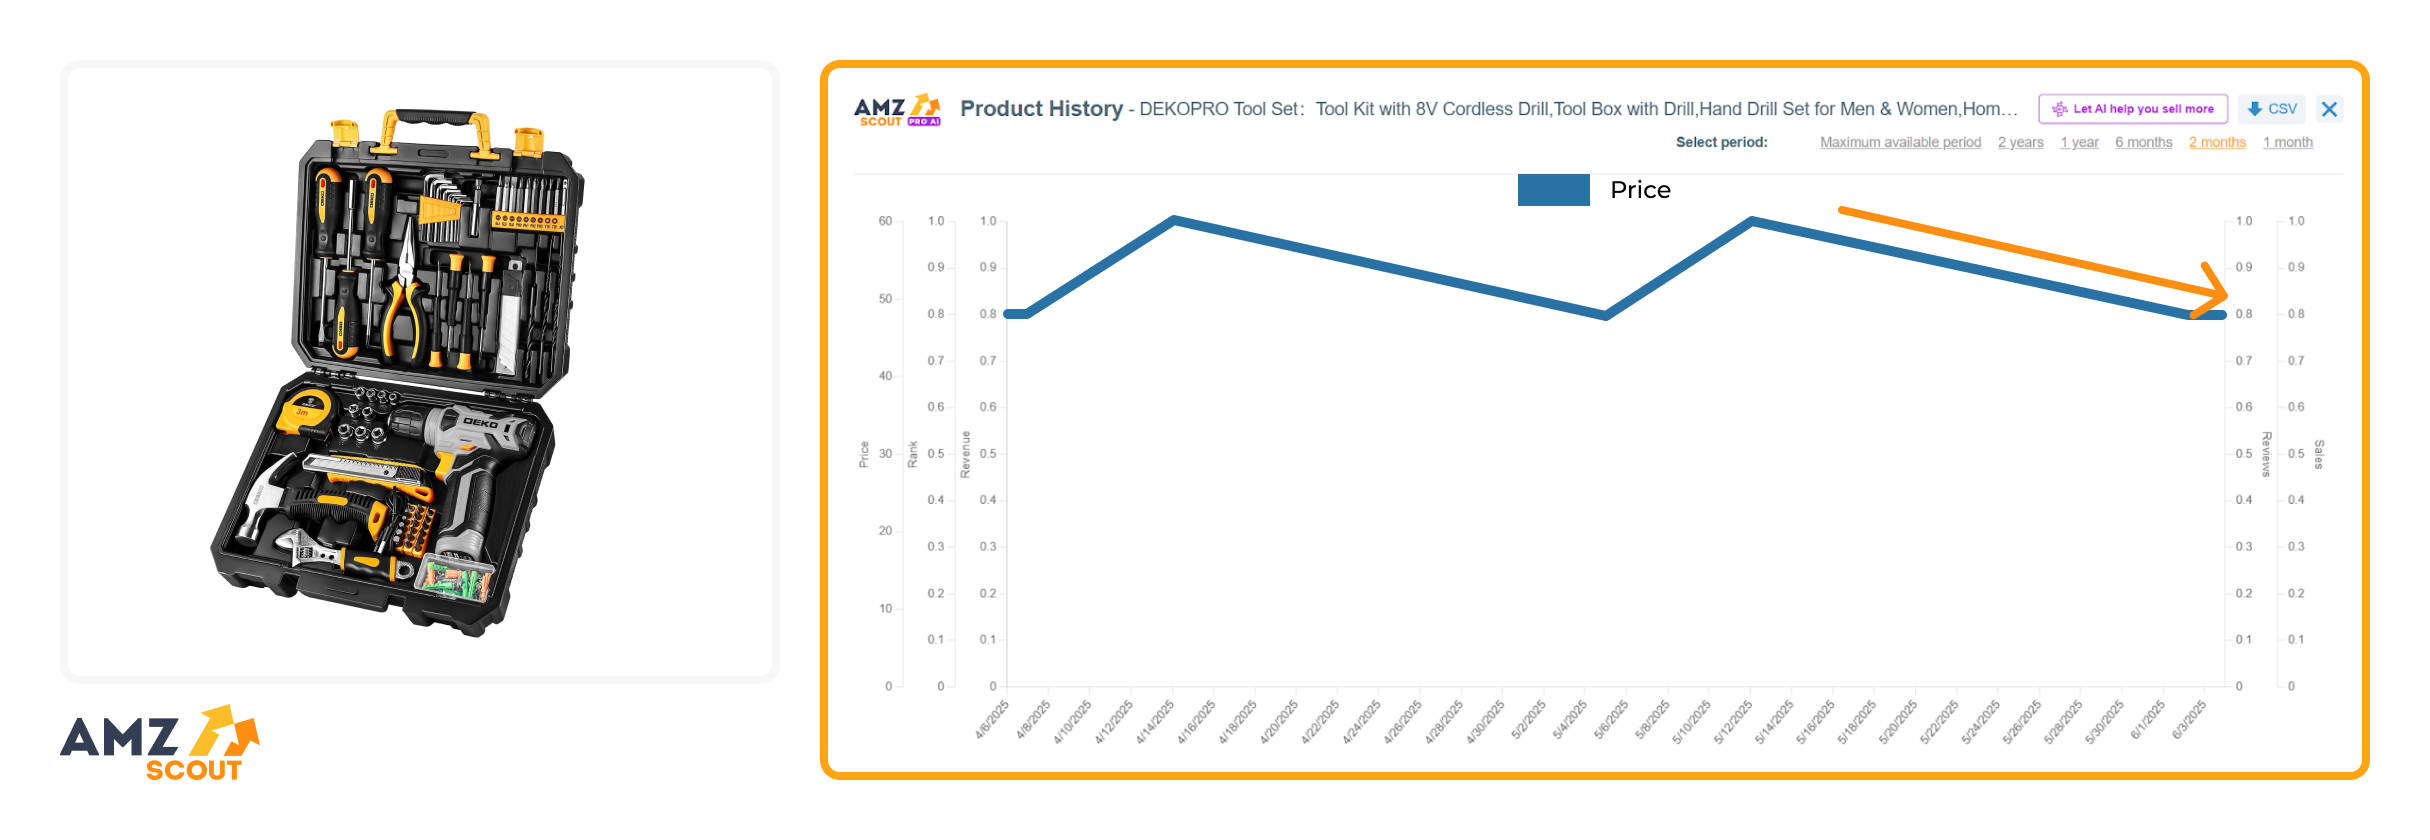
2. Home Tool Kits for House
The PRO AI data indicates that this tool kit has experienced a 20% price dip over the past two months, dropping from $60 to $48. This decrease could be driven by sellers looking to boost sales ahead of Father’s Day. It presents a strong opportunity for both customers looking for a deal and sellers aiming to flip timely gift items.
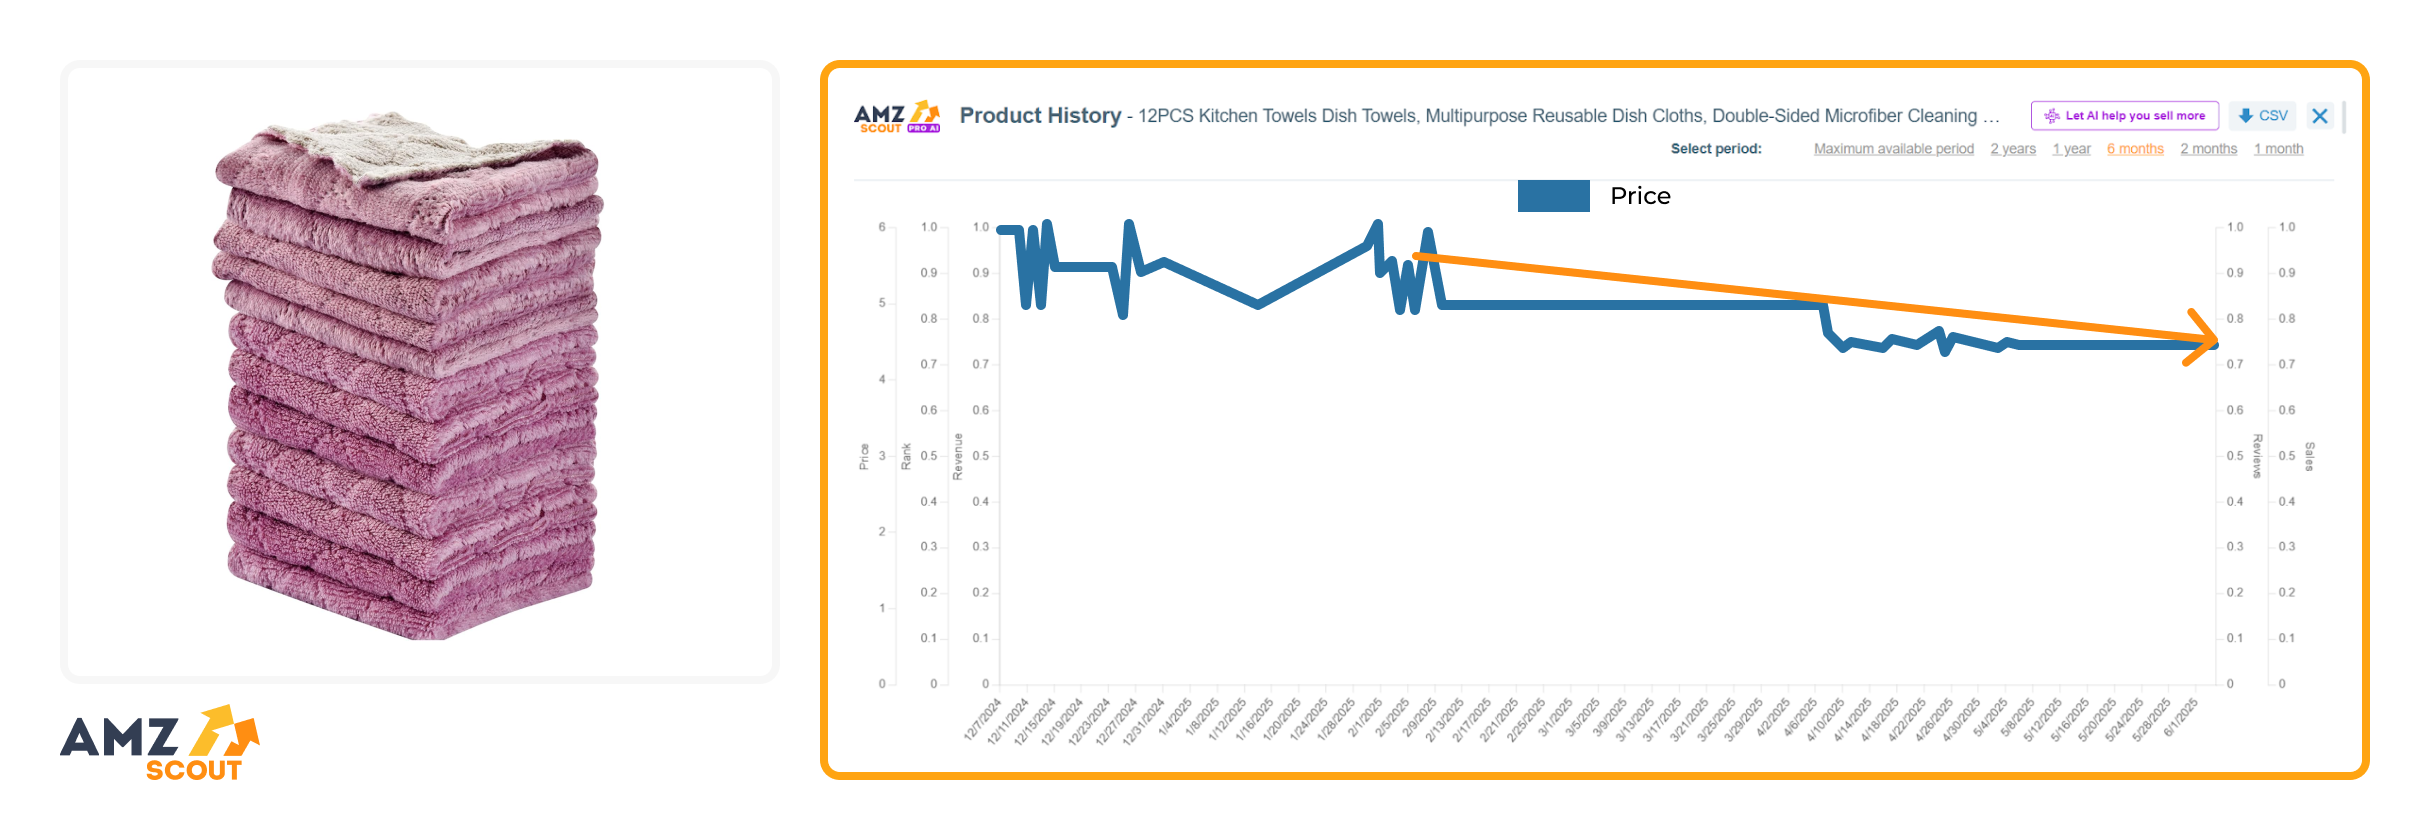
3. 12-Piece Kitchen Dish Towels
According to AMZScout data, the price of these kitchen towels has dropped from $9 to around $4 over the past year, with a steady decline from $6 in the last six months. This drop appears to be driven by stock clearance, making it a great opportunity to buy in bulk at a low cost, for personal use or resale.
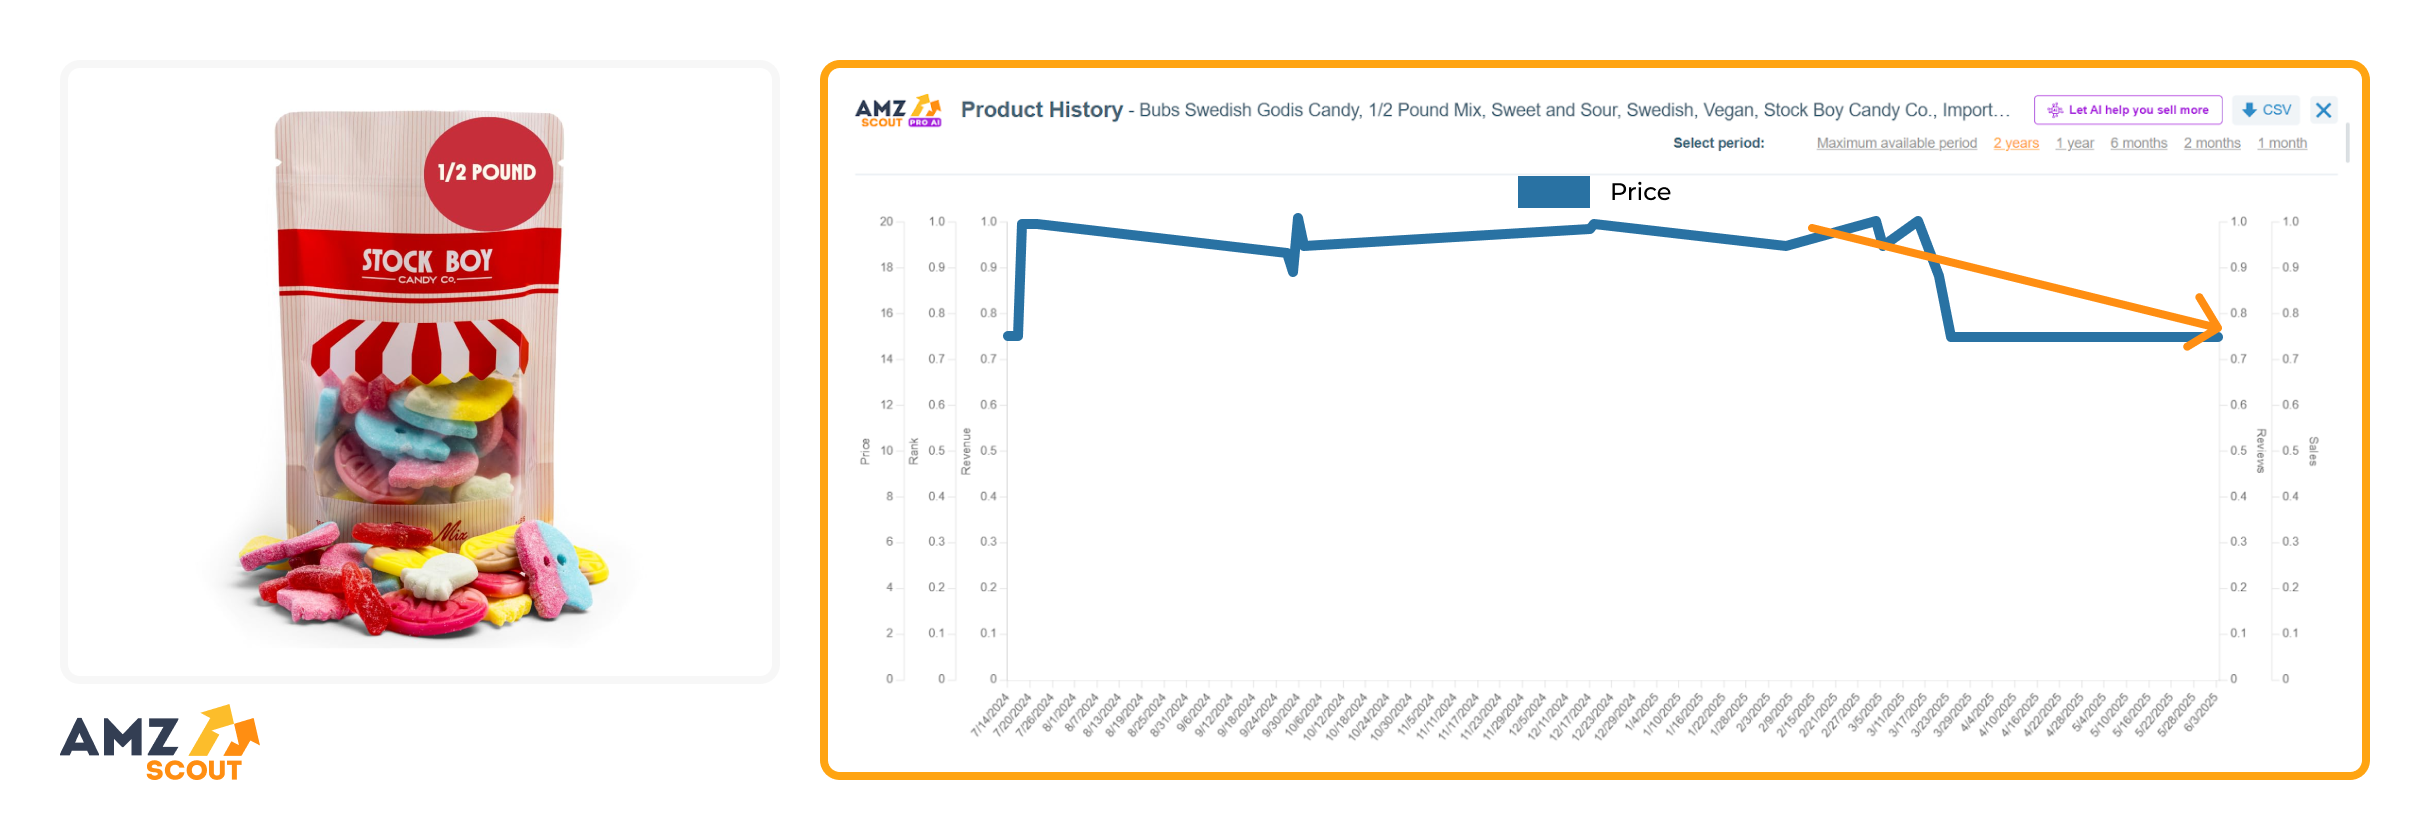
4. Bubs Swedish Godis Candy
This product has seen a 25% price drop over the past three months according to the PRO AI, falling from $20 to $15 with no signs of recovery so far. While demand remains steady (driven by TikTok trends and its natural ingredients), increased competition may be keeping prices down.
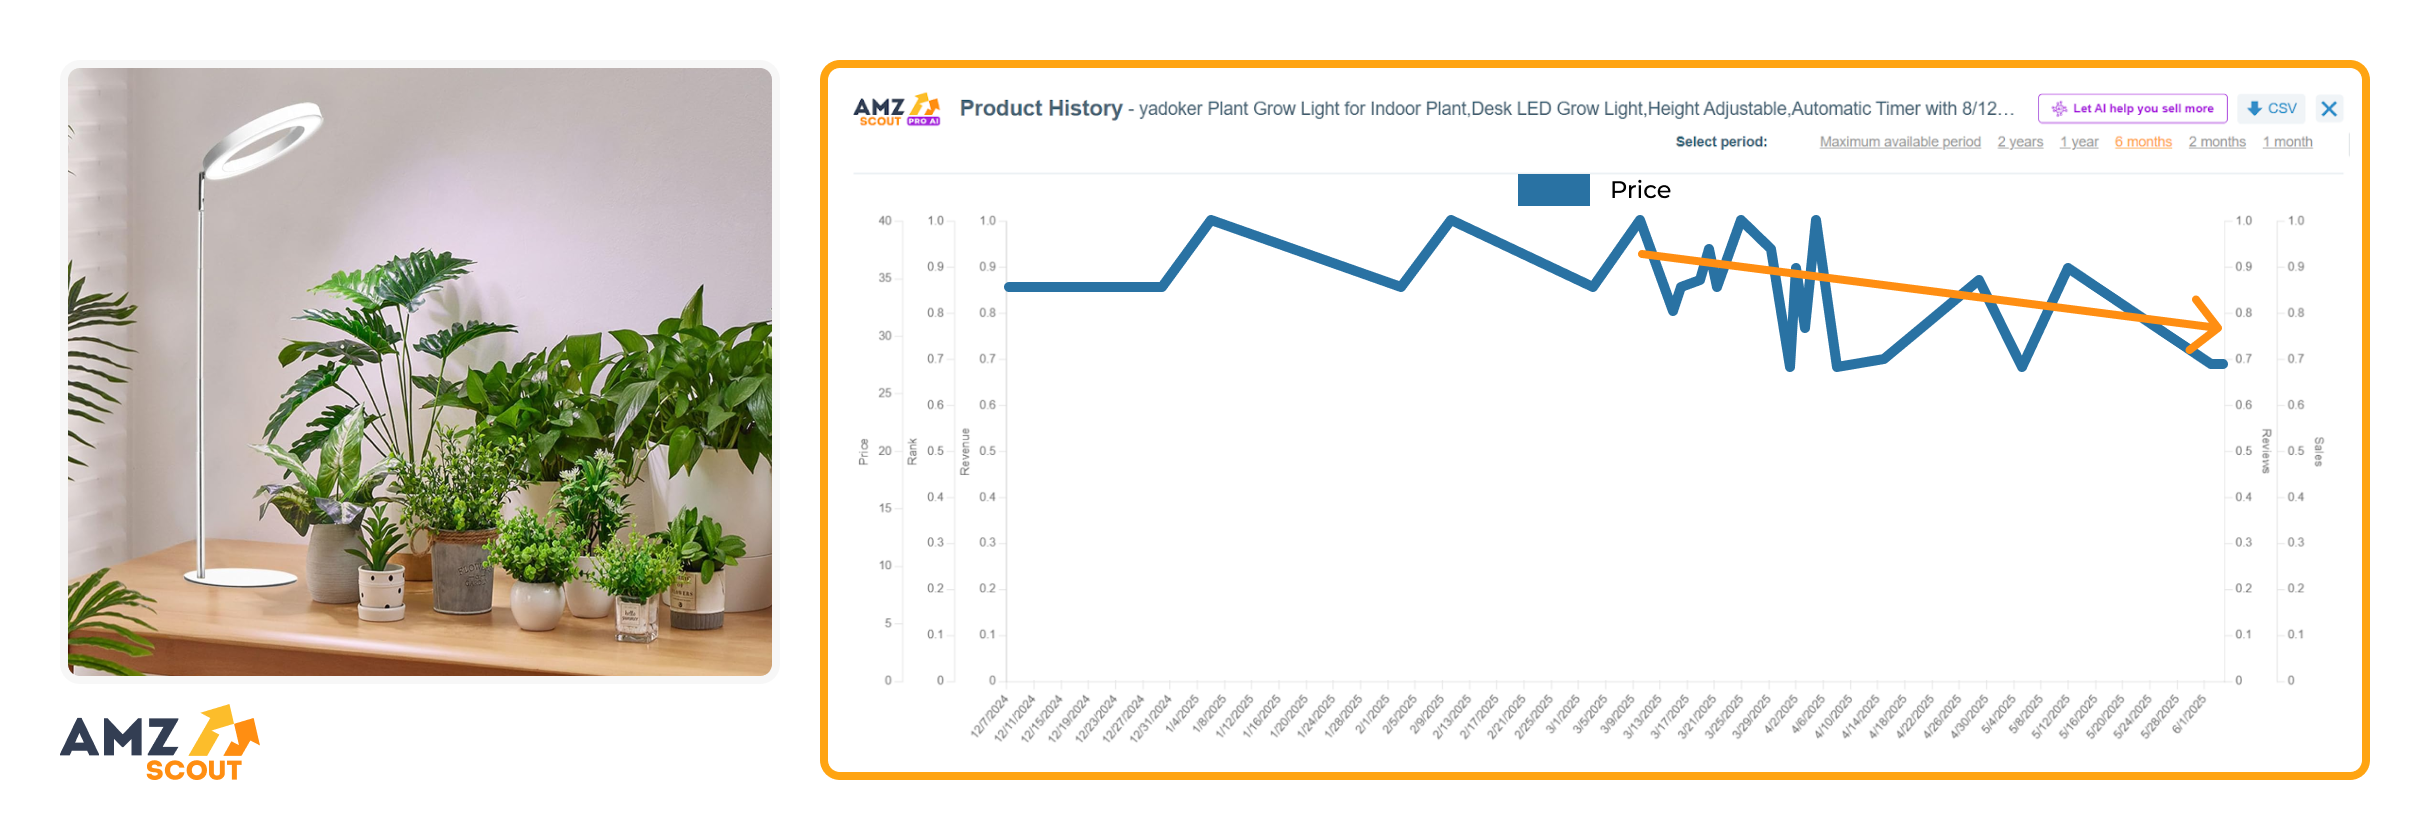
5. Plant Grow Light
According to AMZScout PRO AI, this product’s price has dropped from $35 to $18 over the past six months—nearly a 50% decrease. The drop may be tied to seasonal demand, as interest in indoor gardening tends to fluctuate. Both customers and sellers should watch this trend closely so they can buy or resell at the right time.
Monitoring these trends can help you score undervalued deals or boost your profit margins when flipping on Amazon.
What Factors Cause Amazon Prices to Change?
When examining the price history of products on Amazon, it is crucial to comprehend the factors that contribute to price fluctuations.
Here are a few reasons the price of a product might change throughout the year:
Competition: When multiple sellers are competing for the buy box there’s a lot of pressure to have the lowest price. As a result, sellers might lower their price in order to win the buy box and generate more sales.
Demand: As a product becomes more popular people will be willing to pay a higher price for it. Sellers recognize this and bump up their prices as the demand increases.
Supply: If there’s a limited supply of a certain product it inherently makes it more valuable. So, sellers will usually increase their price if they know they have something that’s in short supply.
Time of Year: Some items sell better during certain times of the year. For example, pool toys sell better in the summer and snow shovels sell better during the winter. Sellers will raise the prices of their products when they’re in high demand and lower their prices when people are less likely to buy them.
Sale Season: Price drops during Amazon sales events like Prime Day and Black Friday can lead to significant savings on popular products. These discounts are often time-sensitive, encouraging customers to act quickly to secure the best deals.
These are just a few of the reasons prices might rise and fall. These changes happen regularly, sometimes daily, so it’s important to monitor the price of your products as much as possible.


Conclusion
Staying informed about price fluctuations on Amazon, especially during major sales events, is key to making informed purchasing and selling decisions. By actively monitoring price trends, customers can ensure that they’re taking advantage of genuine discounts and securing the best possible value, while sellers can refine their strategies to stay competitive in a dynamic marketplace.
FAQs
How do I track the price of an item on Amazon?
You can track Amazon prices using price-tracking tools or browser extensions that monitor product listings. Simply add the item you want, and the tool will send alerts when the price changes. This helps shoppers spot genuine discounts and decide the best time to buy.
What are the best tools to check product price history on Amazon?
Popular tools for checking Amazon price history include AMZScout, CamelCamelCamel, and Keepa. These platforms display detailed pricing charts, historical trends, and sales rank data. With these insights, shoppers can confirm if discounts are real and sellers can plan smarter pricing strategies, making them essential for informed buying and selling decisions.
How often does Amazon update prices?
Amazon updates product prices frequently, sometimes multiple times per day. Price adjustments depend on factors like demand, competitor pricing, seasonality, and promotions. This dynamic pricing strategy ensures competitiveness but makes it harder for buyers to track changes manually, which is another reason why price-tracking tools are so helpful.

