Amazon ACoS: Is Your Competitor’s ACoS Better Than Yours?
With many different ad formats to choose from, each with their own purpose, mechanics, and their individual set of KPIs to optimise for as well as a very dynamic environment – advertising on Amazon has only gotten more complex.
That’s why more and more advertisers wonder: How am I doing?
Based on advertising data of over $2.5b+ in Amazon ad spend data worldwide, Sellics has created the brand new - and free - Sellics Benchmarker Tool [Beta] that gives you benchmarks for the most important advertising KPIs tailored to your industry and marketplace.
Table of contents
- Sponsored Brands Ads in Electronics Have the Best CTR
- Health & Household Has the Best PPC Conversion Rate (14.6%)
- CPCs are lowest for Sponsored Brands and Clothing
- ACoS: Large Differences Between Industries, Ad Types and Marketplaces
- Get Access to the Sellics Benchmarker [Beta] for your individual Benchmarks
In this article, based on the Sellics Benchmarker [Beta] data, we take a look at benchmarks for key advertising KPIs for the most important ad types on Amazon: Sponsored Products and Sponsored Brands, focusing on 3 top categories on Amazon.com: Electronics, Health & Household, and Clothing.
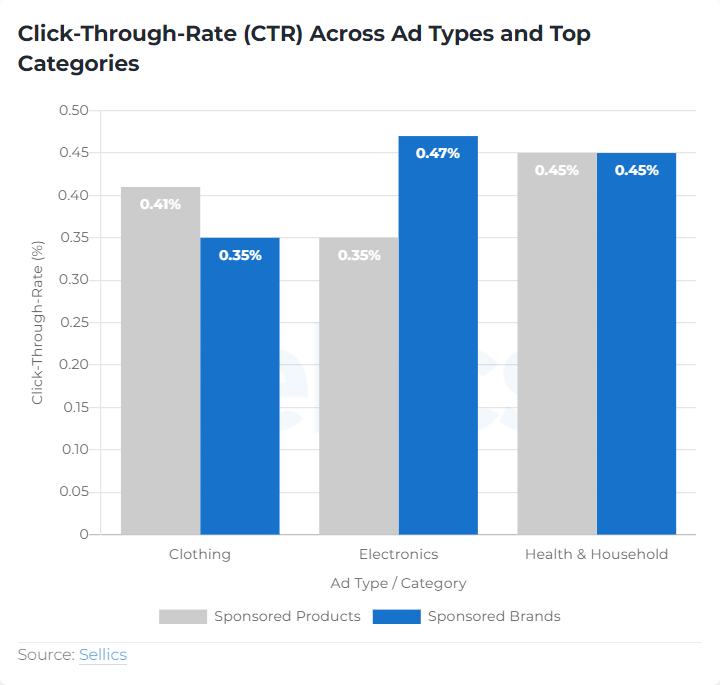
Sponsored Brands Ads in Electronics Have the Best CTR
Looking at your CTR in comparison with your peer group, you can gauge if there is potential to make your product ads more appealing to your customers and if your ads are able to stand out from the crowd to convince customers to learn more out more about your product.
In comparison across all Amazon categories, CTRs are generally higher for Sponsored Products across the different categories. This suggests that customers might perceive Sponsored Products ads less often as actual ads as they blend in with organic search results or as more streamlined with their usual purchasing process of looking for specific products.
Vice versa for Sponsored Brands CTRs are generally lower because they might be more clearly perceived as (banner) ads. However as the performance in Electronics shows this isn’t necessarily a disadvantage in terms of CTR.
Shoppers in Electronics and similar categories that have a higher brand affinity might value the curated and branded shopping experience of a brand store. For more complex products as is true for many Electronics products, shoppers might also be more likely to click on Sponsored Brands Video Ads that explain and showcase a product in detail.
Get early access to the Sellics Benchmarker [Beta] to get CTR benchmarks for your category and marketplace as well as many actionable tips for improving your CTR.
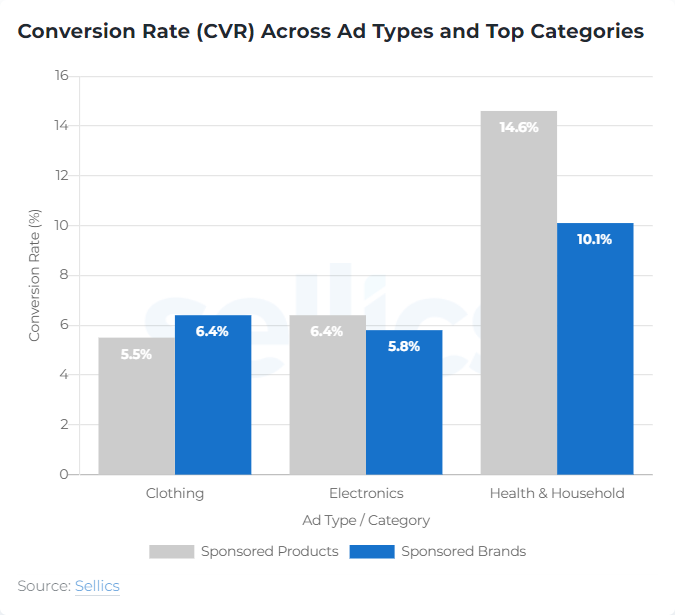
Health & Household Has the Best PPC Conversion Rate (14.6%)
By comparing your CVR with your peer group you can understand if there is potential to improve the persuasiveness of your landing pages (store, product pages or product collection pages) or the fit between your ads and landing pages in terms of expectation management and customer journey design.
Across all Amazon categories conversion rates are mostly lower for Sponsored Brands than for Sponsored Products. This might be due to the fact that Sponsored Brands ads (with the exemption of video ads) are generally drawing the attention of shoppers to the brand or a collection of products.
Sponsored Products are designed to specifically spark interest for a certain product. I.e. there will be less clicks of shoppers that are not actually interested in the products being presented on the landing page.
Sponsored Brands ads generally have the goal of generating brand awareness and consideration (high and mid funnel) vs direct purchases (low funnel), i.e. they are designed to prepare purchases that happen at a later stage in the funnel not being attributed directly to the Sponsored Brands ad.
Comparing CVRs across categories we see that Health & Household has a much higher CVR than Electronic and Clothing. This might be due to the fact that products in Health and Household tend to be more functional and repeat purchase products, so that more shoppers are visiting Amazon with a specific purchase intent.
Customers looking for products in Electronics or Clothing in comparison might be shopping more often for entertainment or distraction or might research more expensive products before buying them.
Get early access to the Sellics Benchmarker [Beta] to get CVR benchmarks for your category and marketplace as well as many actionable tips for improving your CVR.
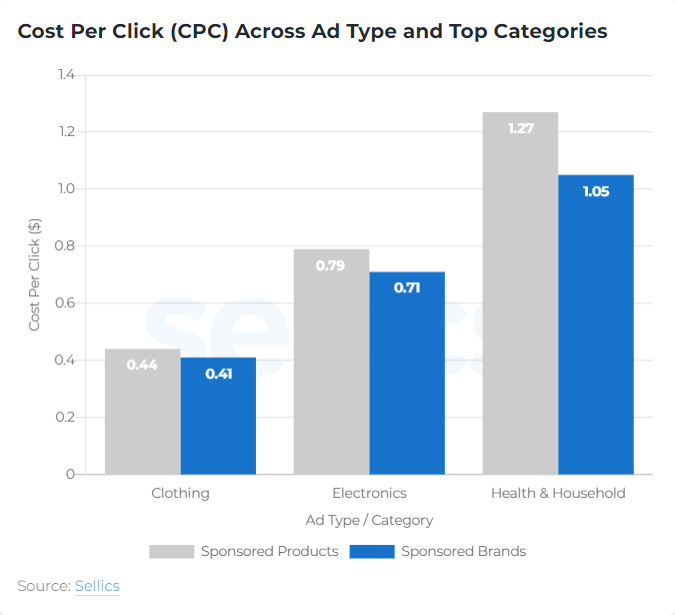
CPCs are lowest for Sponsored Brands and Clothing
The CPC generally indicates the level of competition in a category. If your CPC is much higher than in your peer group, this might be indicating that you are overpaying and therefore should reduce your costs. If your CPC is much lower than in your peer group than you might miss impressions, clicks and sales because your bids are not competitive.
However, what an optimal CPC is also highly depends on your individual products. You have to ask yourself what you can afford to pay (depending on your profit margin) and what you are willing to pay (depending on your advertising goals).
Across all Amazon categories CPCs tend to be lower for Sponsored Brands than for Sponsored Products. This trend is also observable for the 3 top categories.
Comparing CPC levels across the 3 categories we see that CPCs for Health & Household were the highest for both ad formats. As your CPC varies depending on how competitive a category is, this indicates high competition in the Health and Household category, followed by Electronics, then Clothing.
Get early access to the Sellics Benchmarker [Beta] to get CPC benchmarks for your category and marketplace as well as many actionable tips for improving your CPC.
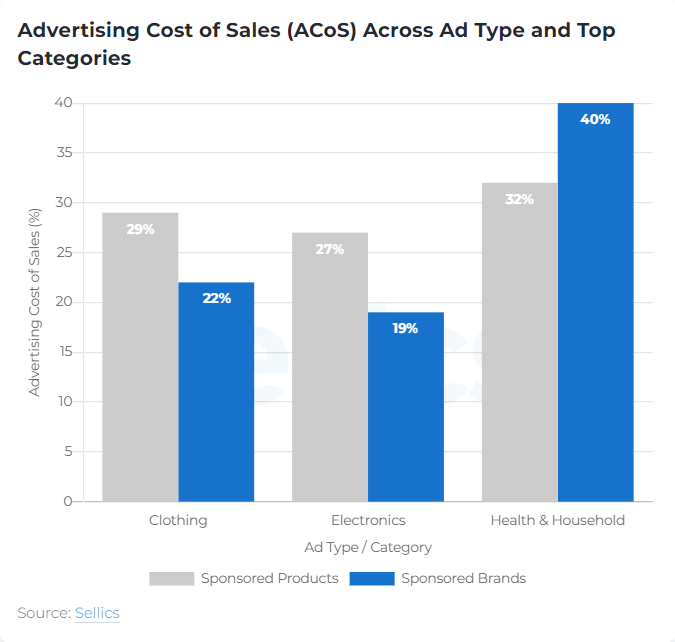
ACoS: Large Differences Between Industries, Ad Types and Marketplaces
Comparing your ACoS to your peer group allows you to see if there is potential to increase the efficiency of your campaigns, e.g. by optimizing your bids or by adding more negative keywords.
However, which ACoS values are realistic to achieve and what a good ACoS is also depends significantly on individual factors for each advertiser. Similar to CPCs, for defining a realistic or good ACoS you have to ask yourself what you can afford to pay (depending on your profit margin) and what you are willing to pay (depending on your advertising goals).
Comparing ACoS between the different ad formats and categories and marketplaces, results are very mixed. This is because ACoS depends on a range of different KPIs – mainly Cost Per Click (CPC), Conversion rate (CvR), and Average Selling Price (ASP). The unique mix of these KPIs in a certain segment determines the average ACoS.
Another reason for different ACoS levels are different advertising goals across ad formats, categories and marketplaces. Segments that put less focus on direct sales and more focus on Customer Lifetime Value (CLV), branding and brand halo effects, customer loyalty and repeat purchases tend to accept a higher ACoS (representing short term direct sales) because they expect that this pays off in terms of achieving these longer term goals.
For both reasons – a unique mix of KPIs and different advertising goals in each segment – it’s very important to benchmark your ACoS against others in your specific industry and marketplace and for a certain ad format. This is the only way to see how well you are doing compared to your competitors.
Get Access to the Sellics Benchmarker [Beta] for your individual Benchmarks
In our article we have shown how you can use the presented Amazon PPC benchmarks to understand how well your PPC campaigns are doing and to identify optimization potential for improvement.
However, the analysis also highlights that results are varying a lot between different ad types, industries and marketplaces. In order to really understand how good (or bad) you are doing, you need to compare your performance with the right peer set.
Try the Sellics Benchmarker [Beta] to get the most accurate results tailored to your business as well as even more tips for improving your campaigns based on your individual results.
What are the benchmarks based on?
The benchmark data is based on an internal sellics study on a sample representing over $2.5b in aggregated annual Amazon attributed ad revenue. The results in this article are based on Q2 2020 data. Averages are calculated as medians to account for outliers.
Author information:
Sellics Advertising is a leading e-commerce and advertising optimization software dedicated to helping clients maximize ad reach, reduce ACoS, and drive product sales and business profit on Amazon. Sellics clients across various Amazon marketplaces use the AI-based automation software supported by predictive insights based on cutting edge machine-learning algorithms. Covering a range of advertising functionalities designed to put clients back into the driver’s seat to help them focus on what really matters - growing their business.

