Key Amazon Metrics to Help Sellers Track Performance
To ensure stability and foster growth in your Amazon business, it’s important that you�’re able to pinpoint areas for improvement. Guesswork alone won’t achieve lasting results. Fortunately, Amazon provides objective metrics that allow you to track performance accurately across multiple aspects of your business.
In this article, we’ll explore 20+ key seller metrics and guide you on how to understand them so you can manage them efficiently.
How to Find Metrics in Your Seller's Account
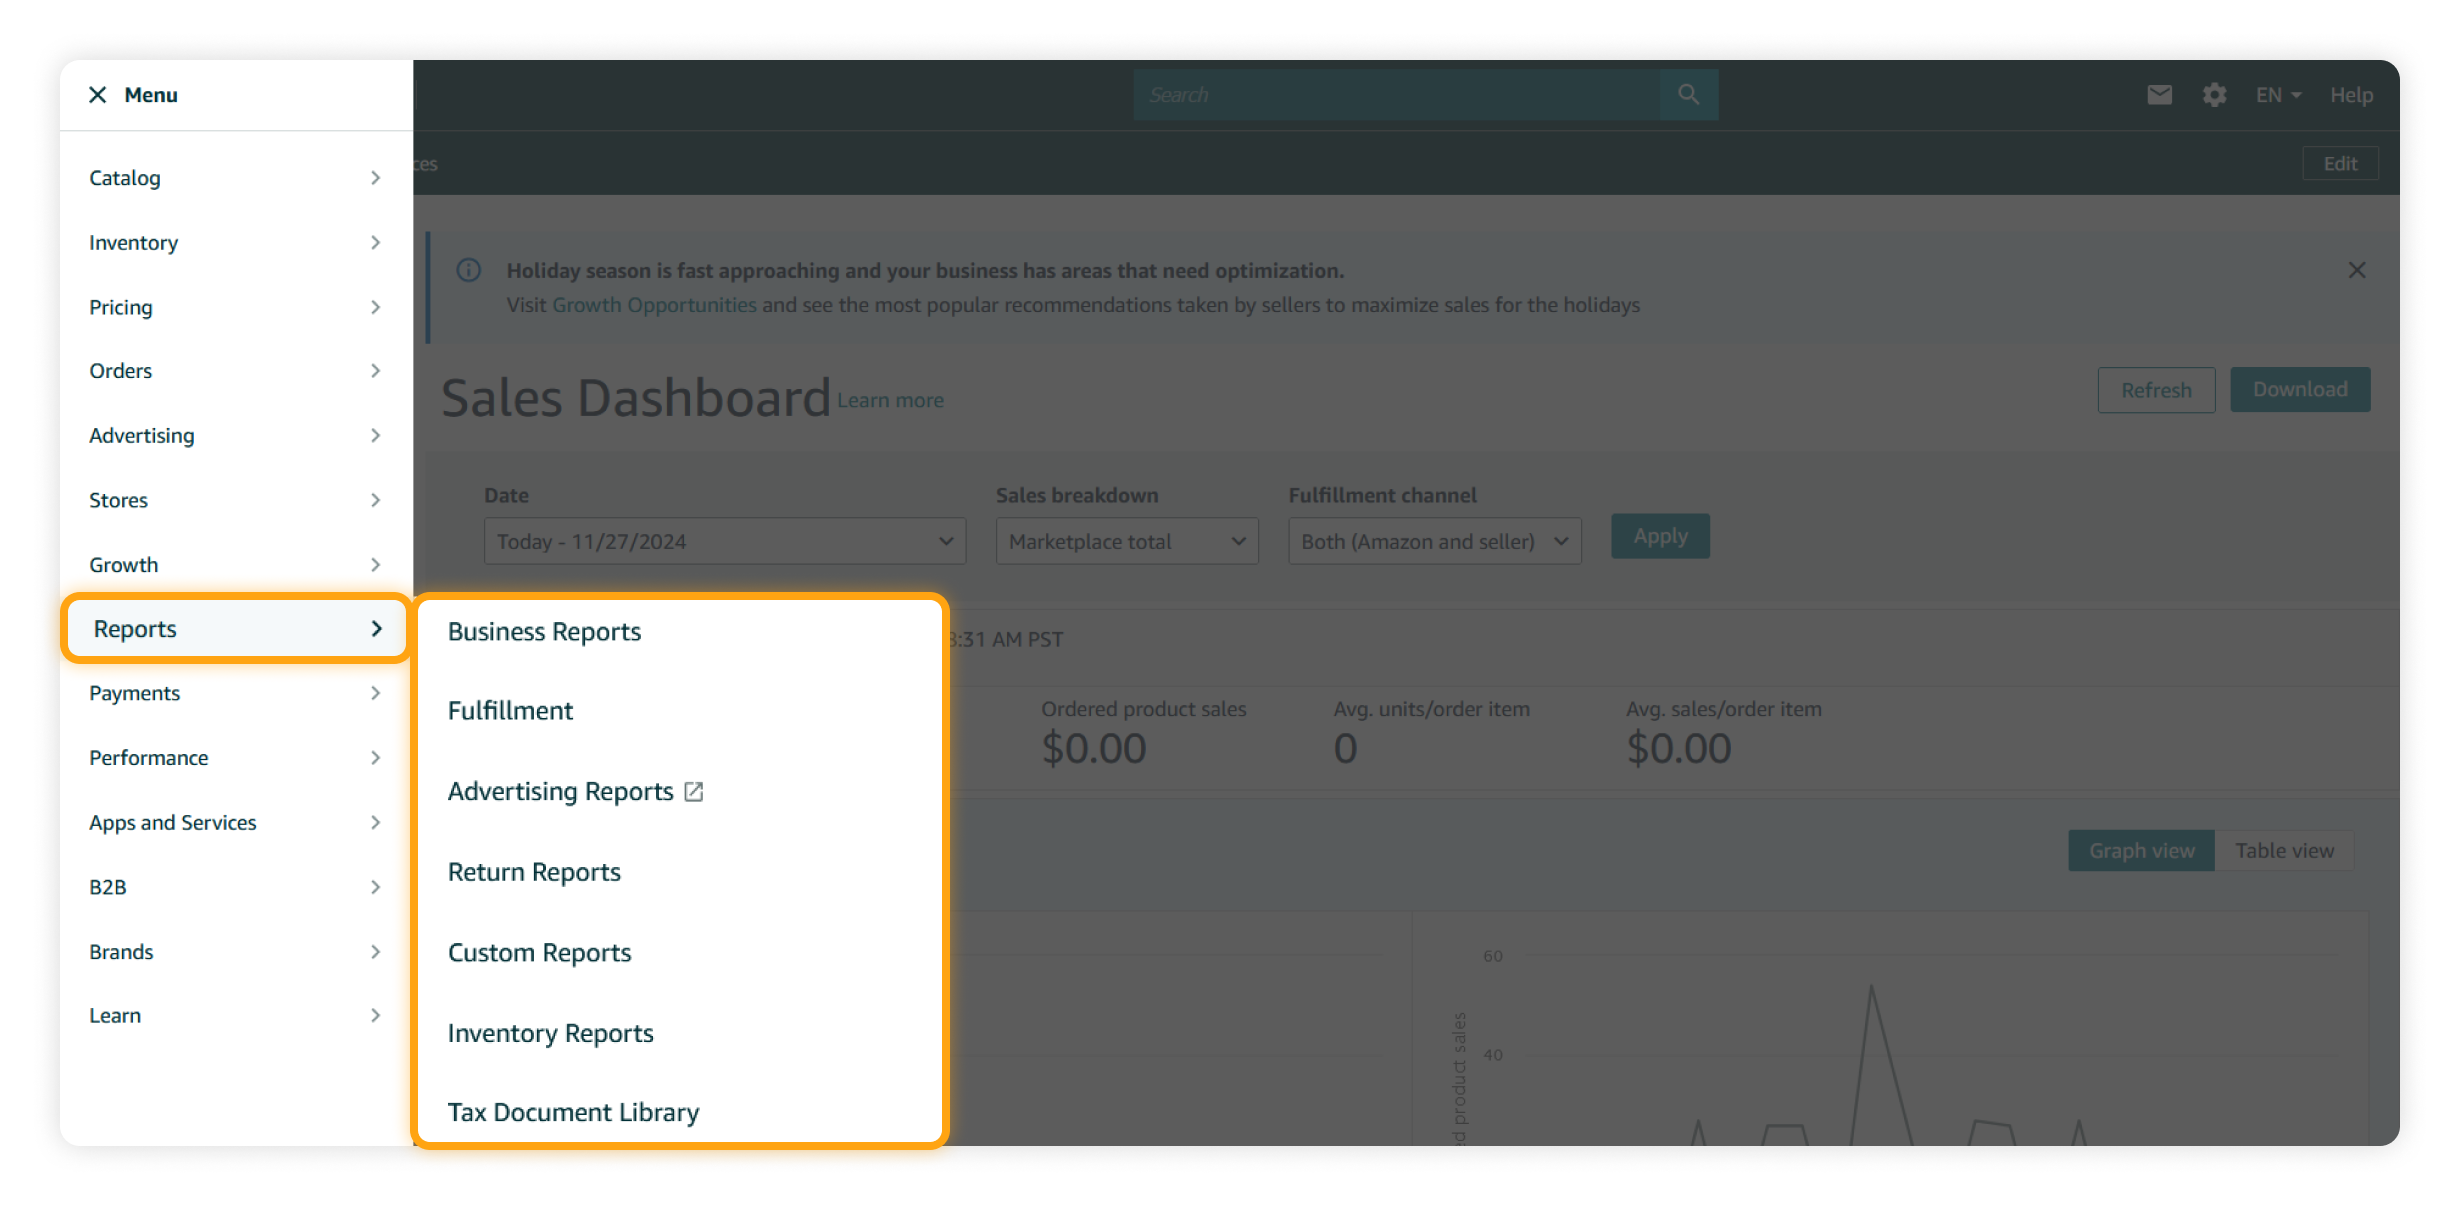
You can access almost all Amazon seller metrics through your Seller Central account under the Reports section. Amazon provides various types of reports, including Business Reports, Advertising Reports, and Fulfillment Reports to provide valuable insights into your sales, advertising effectiveness, inventory management, and more. Reviewing this data regularly enables you to make informed, data-driven decisions.
Utilizing Amazon's reporting tools also allows you to keep track of your key performance indicators (or KPIs). Now let's explore over 20 essential KPIs, grouped into eight key categories, to monitor for a successful Amazon business.
Major Amazon Metrics to Keep an Eye on
We’ve analyzed the experiences of various top Amazon sellers and distilled the most important metrics from Amazon reports to give you an overview of the essential measures for tracking and growing your business. Here are the eight categories of KPIs that can make a difference:
#1 Sales Performance Metrics
The goal of any seller is to drive revenue, which is directly tied to sales performance. By tracking this data, you can gain insights into your profitability. Here are four key metrics to focus on:
Total Sales (Revenue): This is the total price of your items multiplied by the number of units sold. Compare this to your potential net revenue to assess your overall profitability and expenses.
Units Sold: This metric tracks the total number of units sold in a given time frame. It reflects the product’s popularity and how well you're meeting customer demand.
Unit Session Percentage (Conversion Rate): This is the percentage of sessions that result in a sale. A low conversion rate means you might need to improve your product listings, including the keywords or images you include.
Average Order Value (AOV): This is the average dollar amount spent per order. To increase your AOV, you could focus on higher-priced items or experiment with bundling.
These KPIs provide valuable insights into the effectiveness of your business strategy, helping you determine if adjustments are needed to optimize your sales approach for better results.
#2 Advertising & Marketing Metrics
Efficient marketing is key to making your products stand out and attract customers. This involves running strategic ad campaigns and ensuring optimized product listings, especially for branded products.
Amazon PPC is ideal for advertising within Amazon, while some sellers also opt to leverage Amazon's Demand-Side Platform (DSP) to expand their visibility through ads on various sites beyond Amazon. If you have your own brand, optimizing your product listings is essential. Here are some key metrics to monitor for better marketing insights:
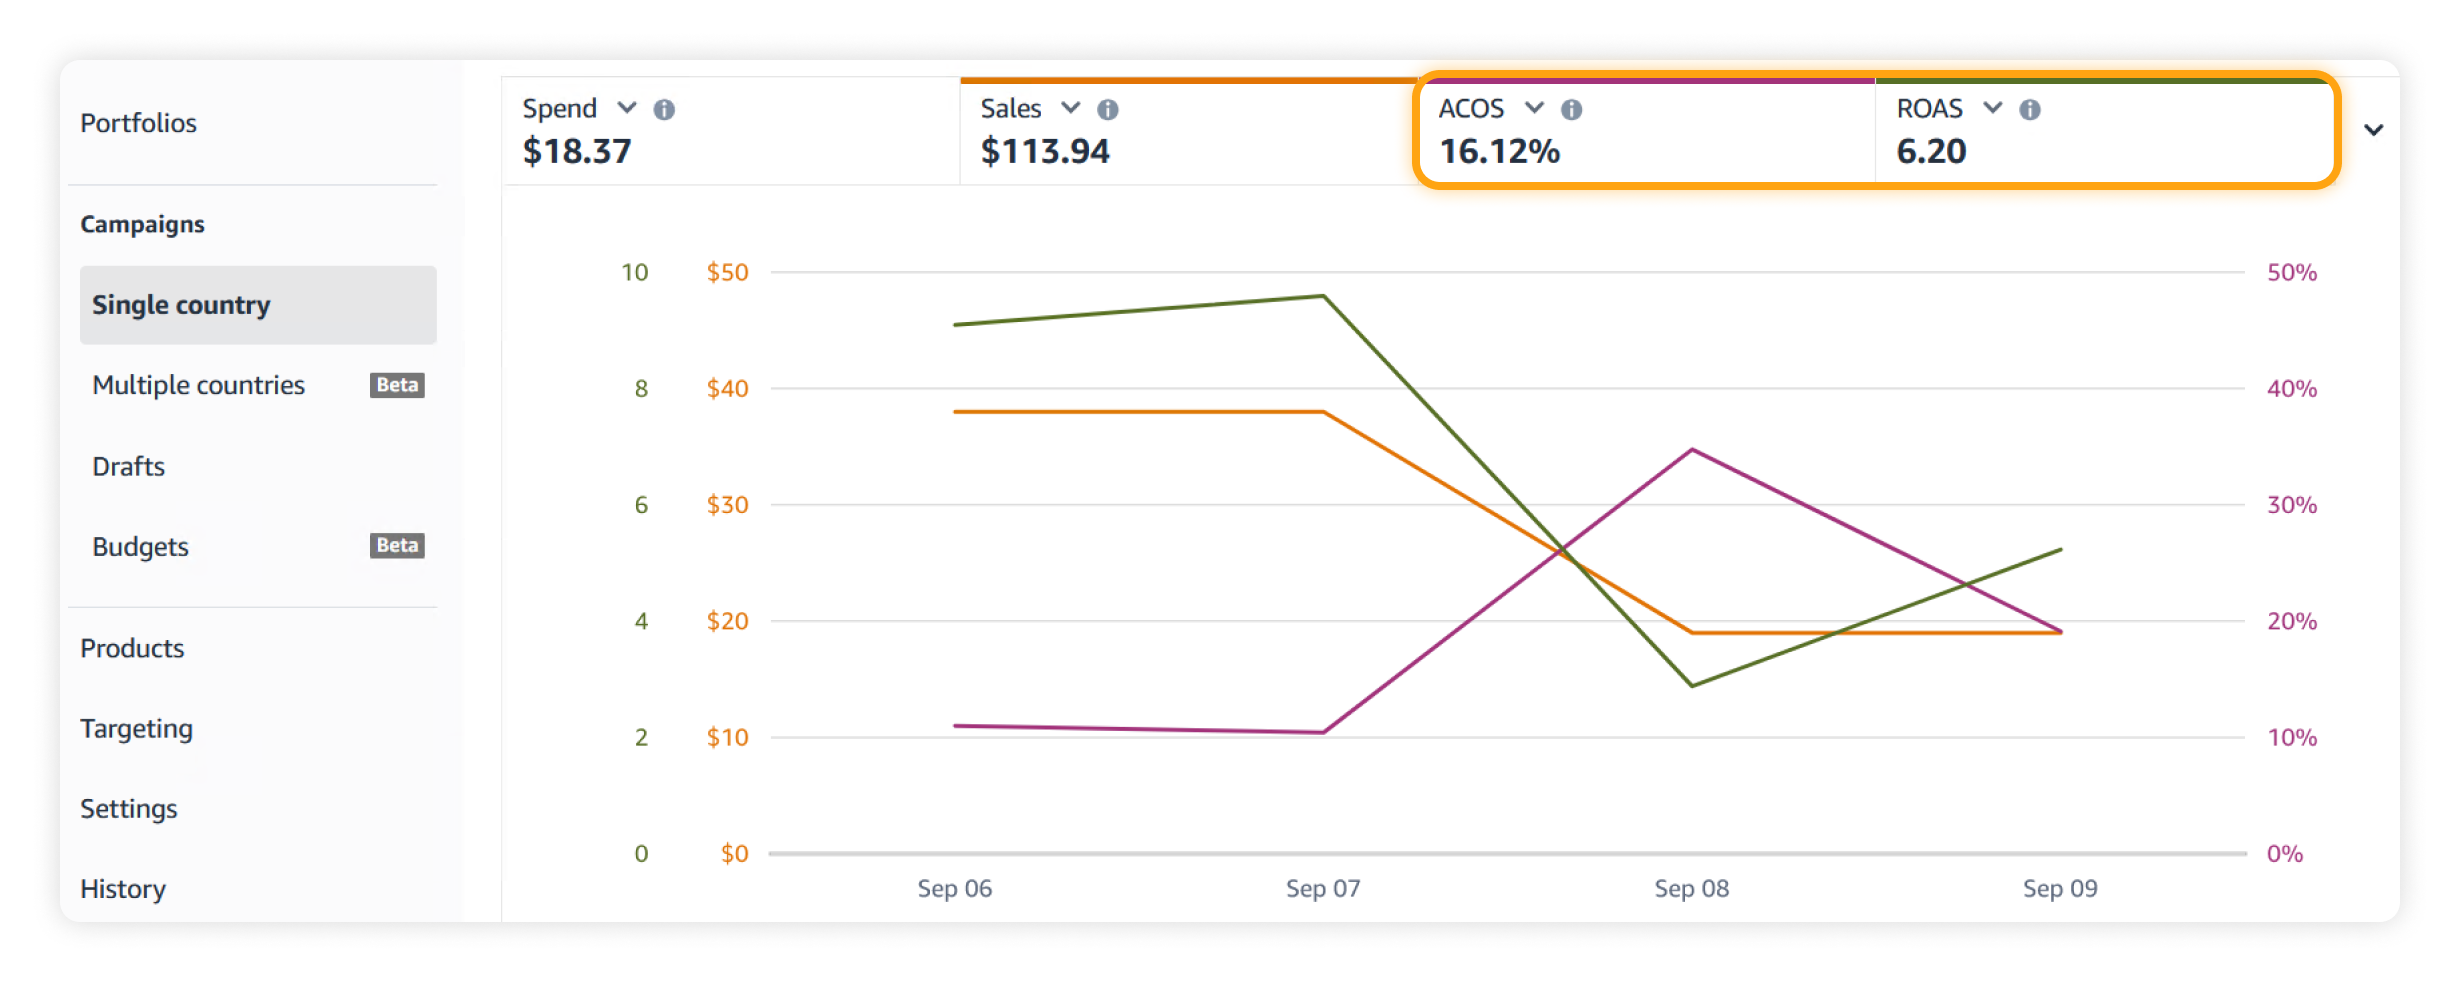
Advertising Cost of Sales (ACoS): This shows how much you’re spending on ads compared to how much you’re making from those ads. A lower ACoS means you’re spending less to make a higher profit.
Total Advertising Cost of Sales (TACoS): This indicates how much you spend on PPC versus all the sales you make, both from ads and regular sales. It gives you a bigger picture of how your ads are impacting your overall revenue.
Return on Ad Spend (RoAS): This tells you how much money you make for every dollar spent on ads. The higher your RoAS, the more profitable your ads are.
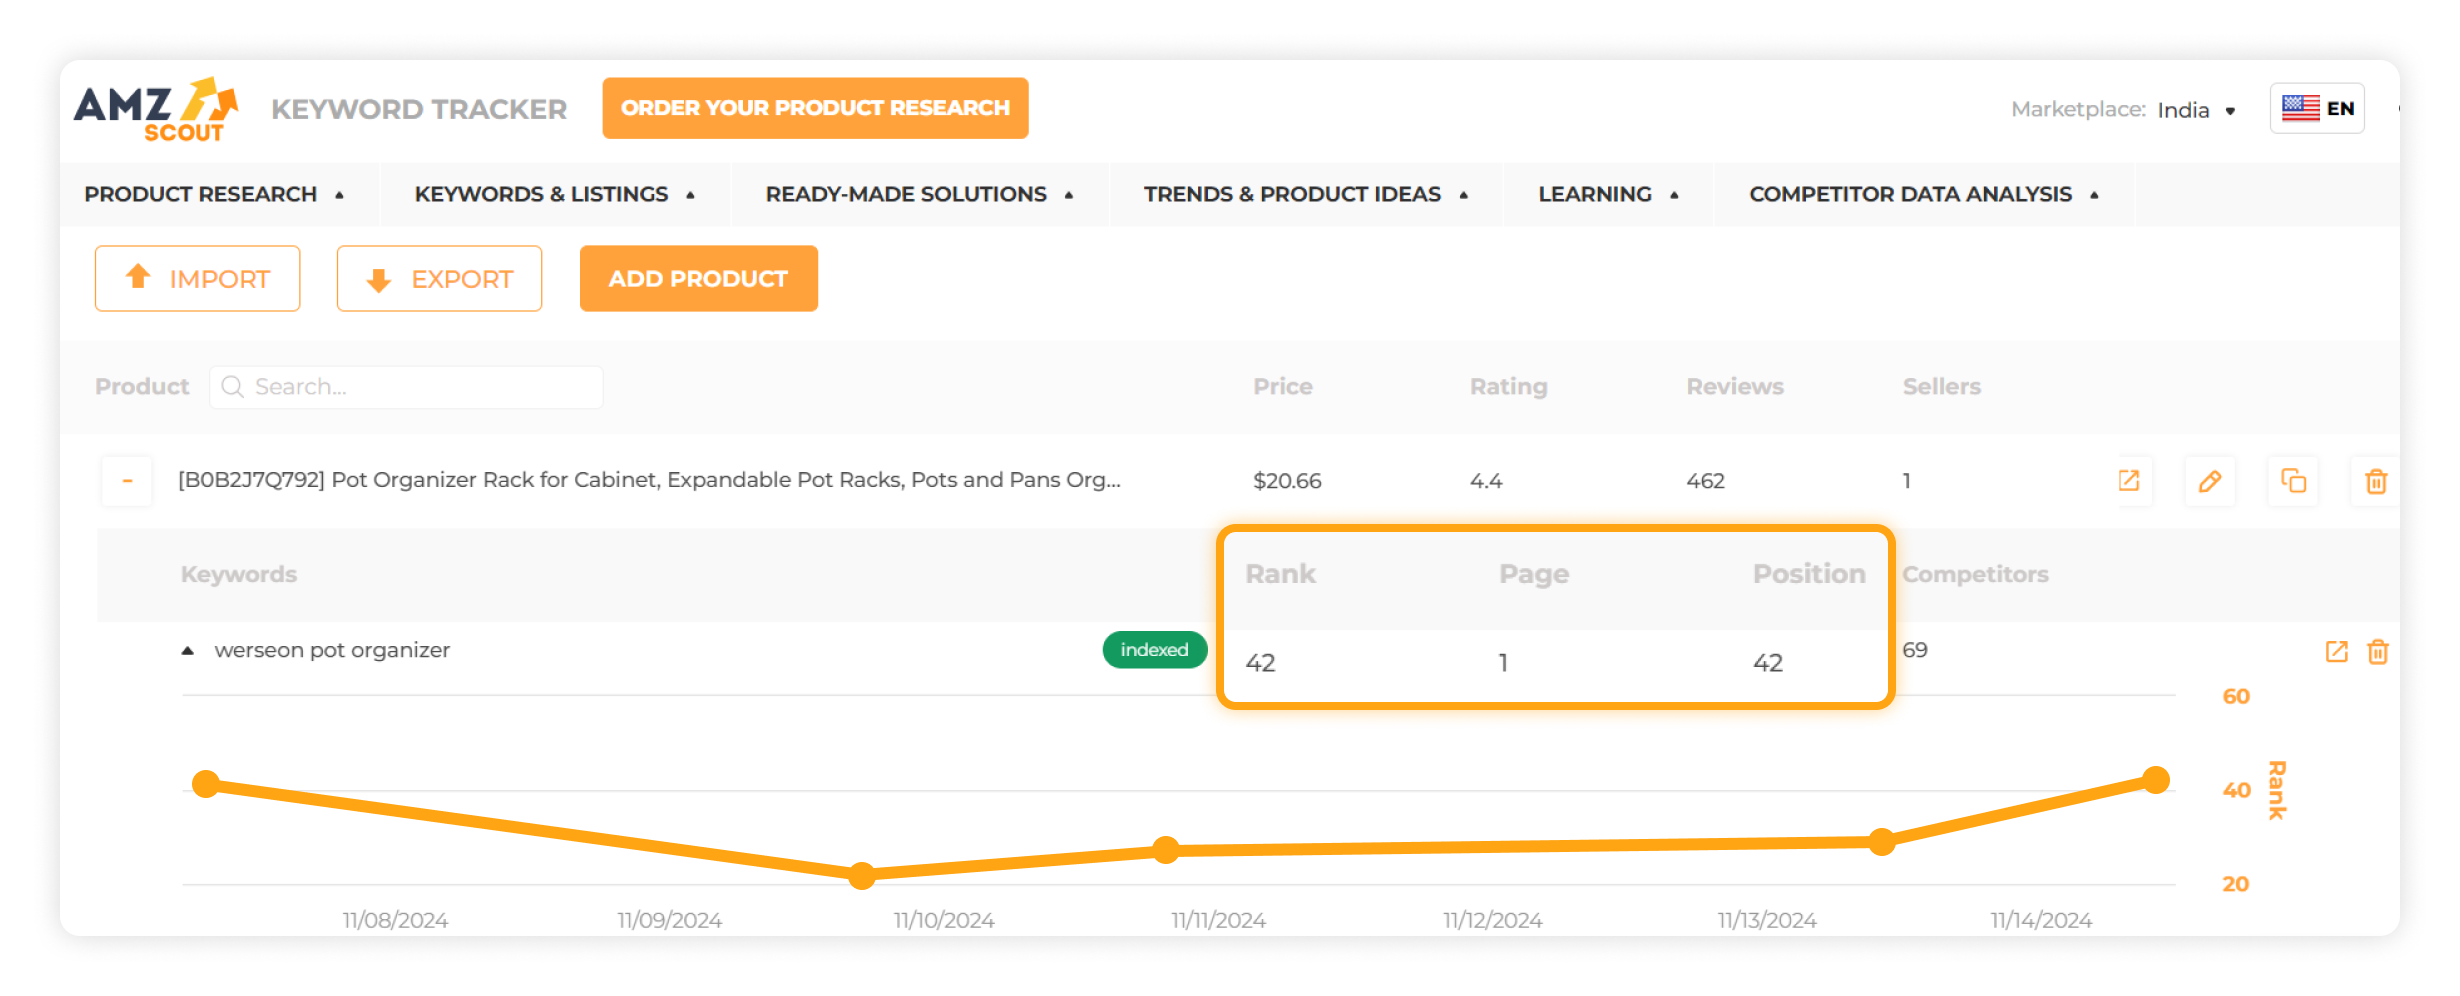
Product Ranking: Shows where your product appears among Amazon search results for certain keywords. A lower ranking boosts your visibility and suggests that your listing is well-optimized, helping you attract more customers.
If you want to stay competitive and adapt to market trends, optimizing your strategy is crucial. Tracking your keyword positions allows you to assess the effectiveness of your listings and ads, ensuring that you attract relevant traffic and improve your visibility on Amazon. This helps you identify areas for improvement and stay ahead of the competition.
Analytical tools simplify keyword performance tracking, with AMZScout’s Keyword Tracker being a top choice for Amazon sellers due to its accurate data, user-friendly interface, and ability to monitor keywords’ performance over time.
Track Your Keyword Performance with the Keyword Tracker
The AMZScout Keyword Tracker lets Amazon sellers track the daily performance of keywords tied to their products as well as those used by their competitors. This tool provides assessment of keyword positioning trends, search ranking, and the visibility of each product.
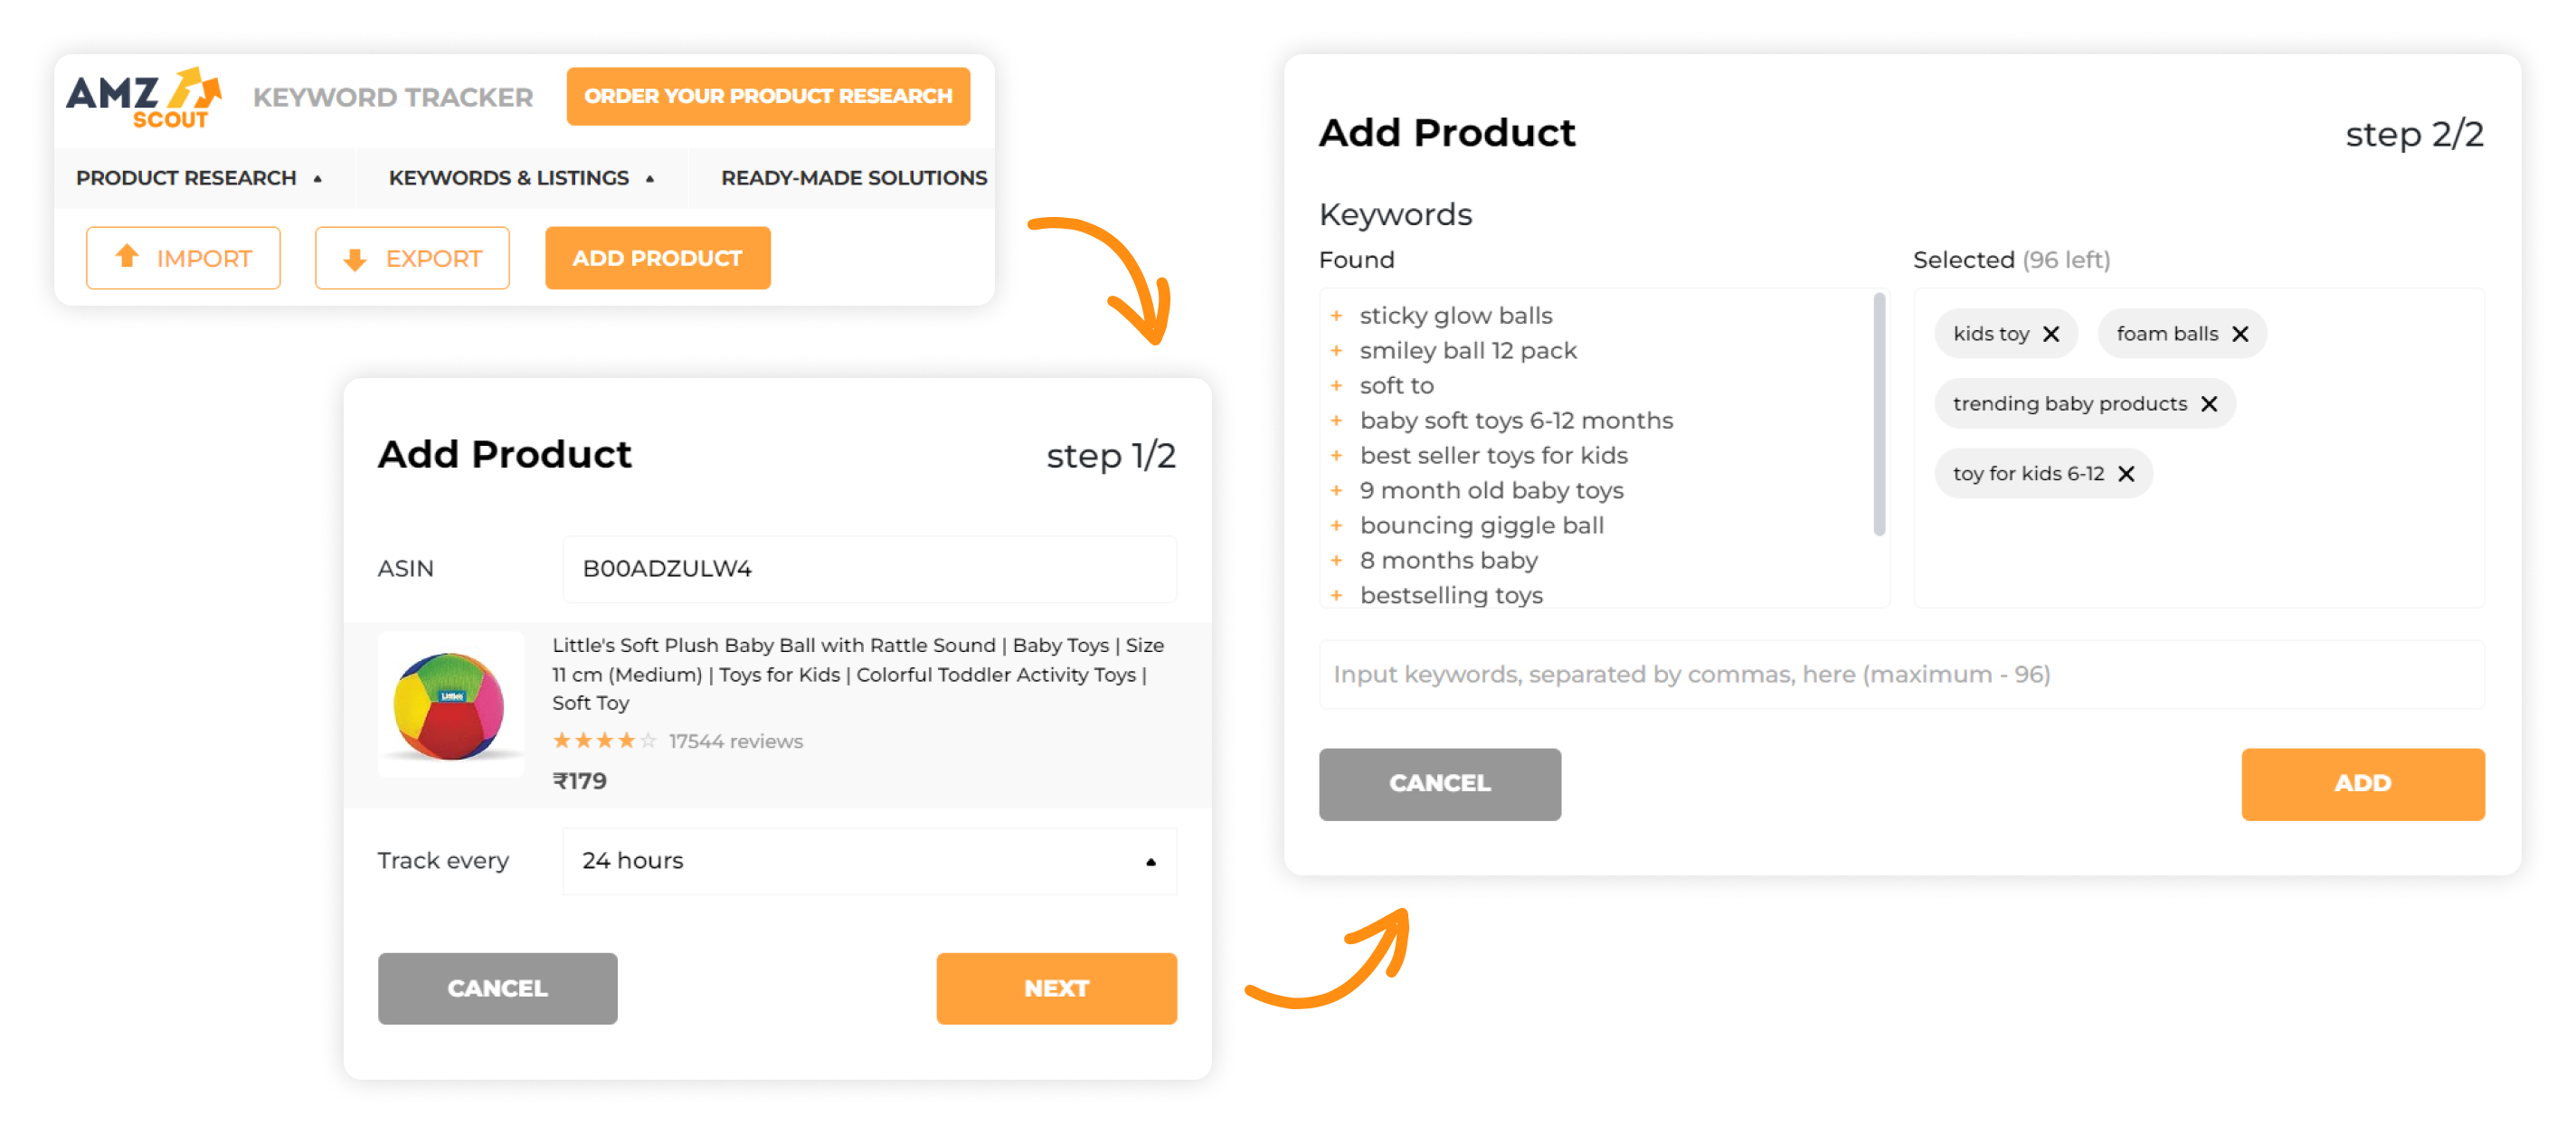
Here’s how to use this tool:
1. Access the Keyword Tracker. To start a free trial, enter your email address.
2. Set up tracking:
Click Add Product and enter the product’s ASIN.
Choose how often you want the tool to update keyword data, from every hour to once each day.
Select the country-specific Amazon marketplace you want to track.
3. Select keywords. Add relevant keywords and begin tracking by clicking the + icon.
4. Review results. Analyze your tracked keywords regularly to see performance changes and identify areas where adjustments may improve your keyword strategy.
By monitoring the performance of your keywords consistently, sellers can fine-tune their listings to increase search visibility and ranking, ultimately boosting traffic and conversions.
#3 Customer Satisfaction Metrics
Keeping customers happy is crucial for your business, and while customer satisfaction can be subjective, several metrics can help you measure it effectively:
Customer Reviews & Rating: This shows the percentage of positive reviews received, reflecting overall satisfaction with your products and services.
Customer Feedback Score: This score reflects the proportion of positive feedback compared to the total feedback over various timeframes.
Buyer-Seller Contact Response Time (CRT): A fast response time is key to maintaining customer satisfaction. Respond quickly, ideally within 24 hours, even on weekends and holidays, as delayed response times can damage your ratings.
These metrics affect your credibility and trustworthiness, so enhancing customer experience is key to maintaining a strong reputation and boosting your chances of generating sales.
#4 Account Health Metrics
The Account Health dashboard provides an overview score based on customer satisfaction, shipping performance, and policy compliance. If your score is between 200 and 1,000, your account is generally in good standing. Here’s what Amazon evaluates for each area:
Refund Rate: Reflects the number of refunds issued. A high rate may signal issues with product descriptions or images, leading to unmet customer expectations.
Seller Rating: Your rating depends on customer feedback, which is why timely and helpful customer service is essential to maintaining a good score.
Product Policy Compliance: Monitors adherence to Amazon’s listing guidelines. Check for updates regularly, as policy changes can impact compliance.
Order Defect Rate (ODR): This tracks the percentage of orders with issues, like complaints or returns, over the past 60 days.
Maintaining low scores across these metrics is crucial for account safety, as underperformance can lead to suspension or removal.
#5 Criteria for Evaluating Competitiveness
Amazon is a highly competitive marketplace where staying ahead requires evaluating your position against other sellers regularly. By focusing on key criteria, you can refine your strategy and make your products stand out. Here are two critical aspects to consider:
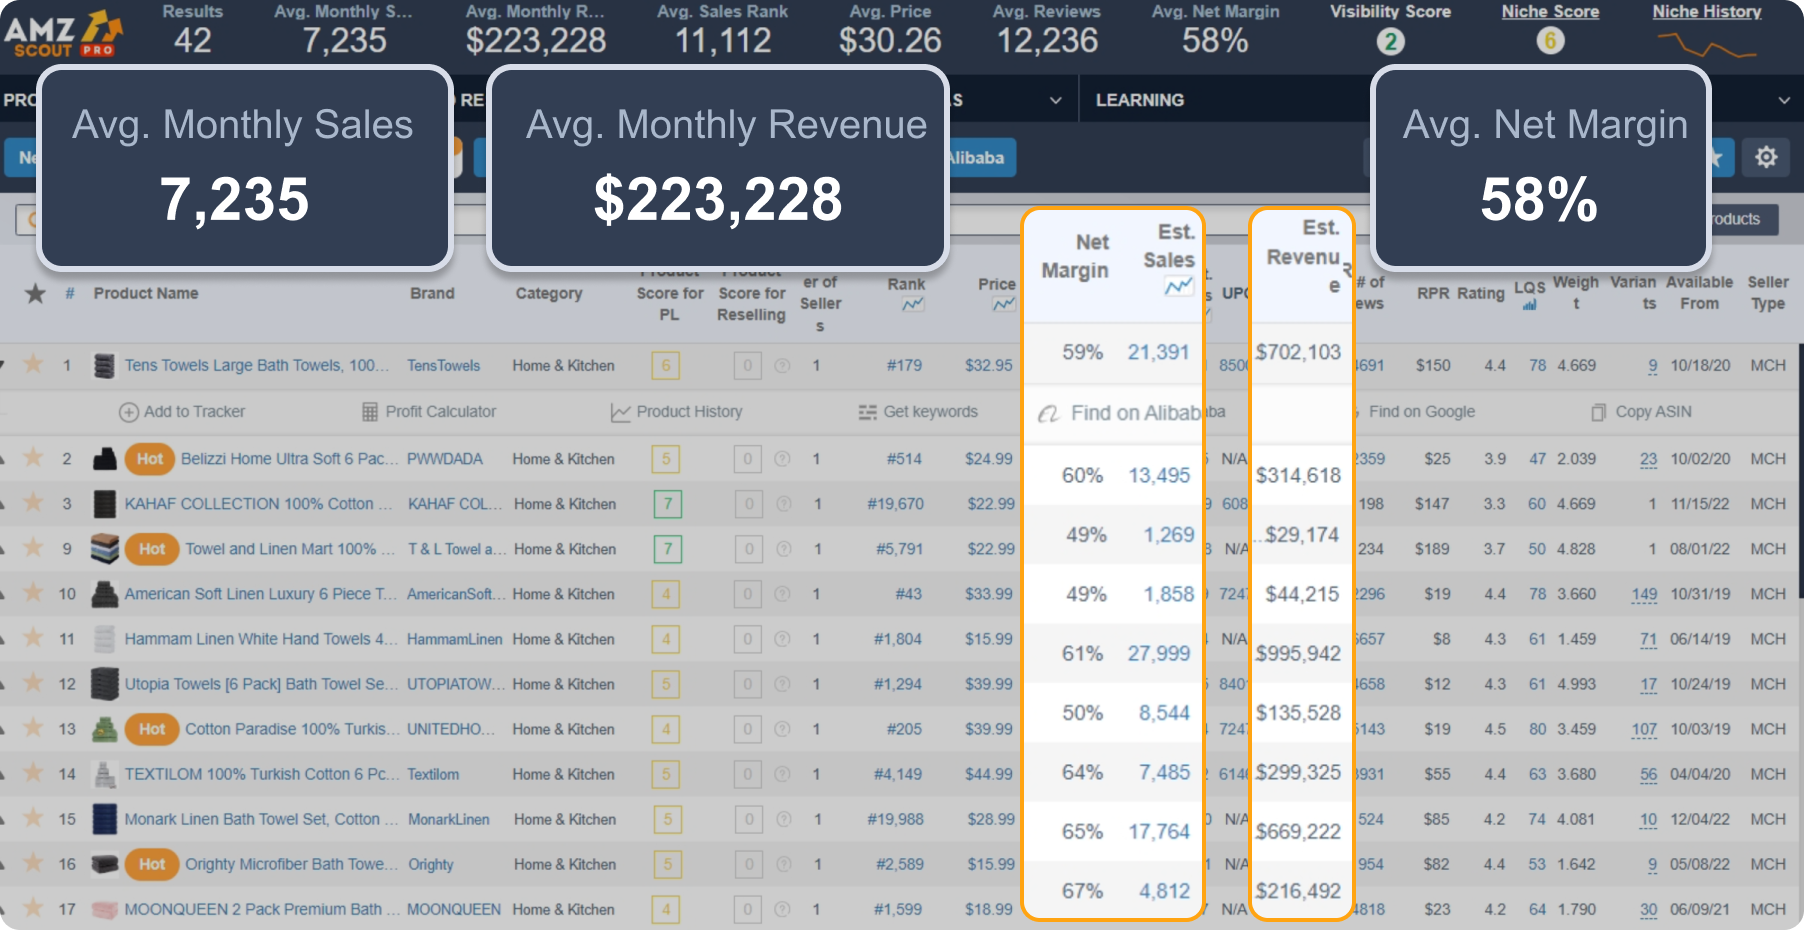
Price Analysis: This involves understanding how your prices compare to those of similar products. Consider using AMZScout PRO to view historical data on product sales and prices, helping you choose competitive prices. The tool’s built-in calculator assists sellers with setting prices that balance competitiveness with profitability.
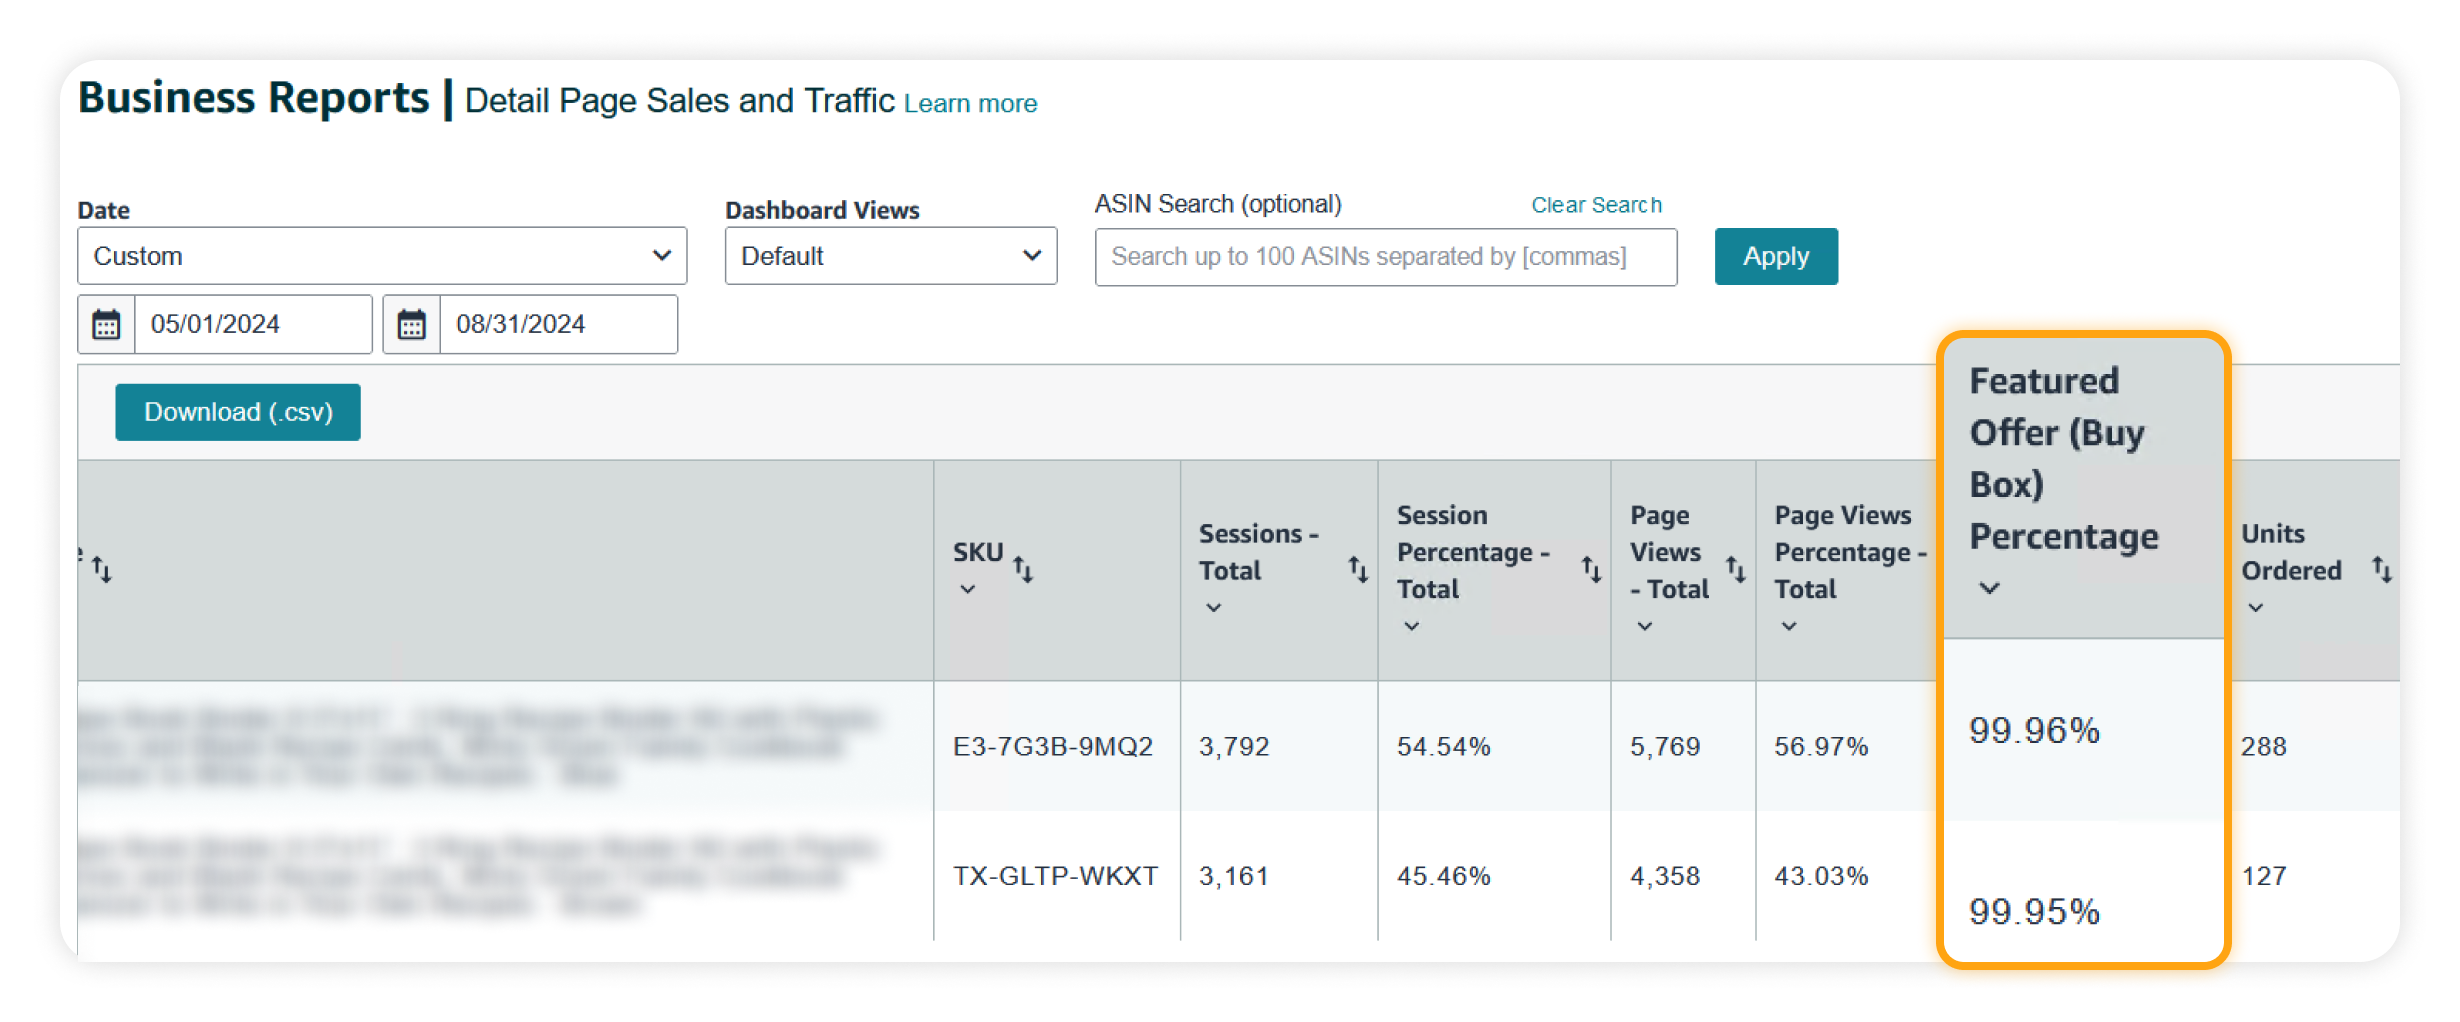
Featured Offer (Buy Box) Percentage (FOP): This metric indicates how often your product appears as an Add to Cart option, which is where most customers make their purchases. A low FOP might signal the need for adjustments, like switching to FBA, to boost visibility and sales potential.
Analyzing these factors regularly enables you to fine-tune your pricing and strategies, ultimately boosting your visibility and success on Amazon.
#6 Fulfillment & Shipping Metrics
If you're not using FBA for fulfillment, it’s especially important to monitor how well you're managing orders and shipping. Customers expect fast, reliable delivery, and failing to meet their expectations can lead to negative reviews and reduced sales. Here are four key metrics to keep an eye on:
Late Shipment Rate: This tracks the percentage of orders shipped later than the expected date. Shipping over weekends or holidays can help prevent delays and reduce the risk of negative feedback.
Pre-Fulfillment Cancel Rate: This shows how often orders are canceled before shipping, which usually occurs due to quality issues or low stock. Keeping a close eye on your product inventory and quality can help reduce cancellations.
Perfect Order Percentage (POP): POP measures how smoothly and accurately orders are fulfilled, indicating your efficiency in completing orders without issues.
Valid Tracking Rate (VTR): This metric reflects the percentage of orders with valid tracking numbers. Using reliable carriers like DHL, FedEx, or UPS can help ensure that your tracking is immediate.
If your fulfillment and shipping fails exceed 4%, Amazon may suspend your account. To avoid this, consider getting additional help or switching to FBA for better fulfillment support if needed.
#7 Inventory Metrics
Effective inventory management helps prevent stockouts and overstocking, making your budget more efficient and maintaining your ability to keep customers satisfied. Here are five essential inventory metrics to monitor:
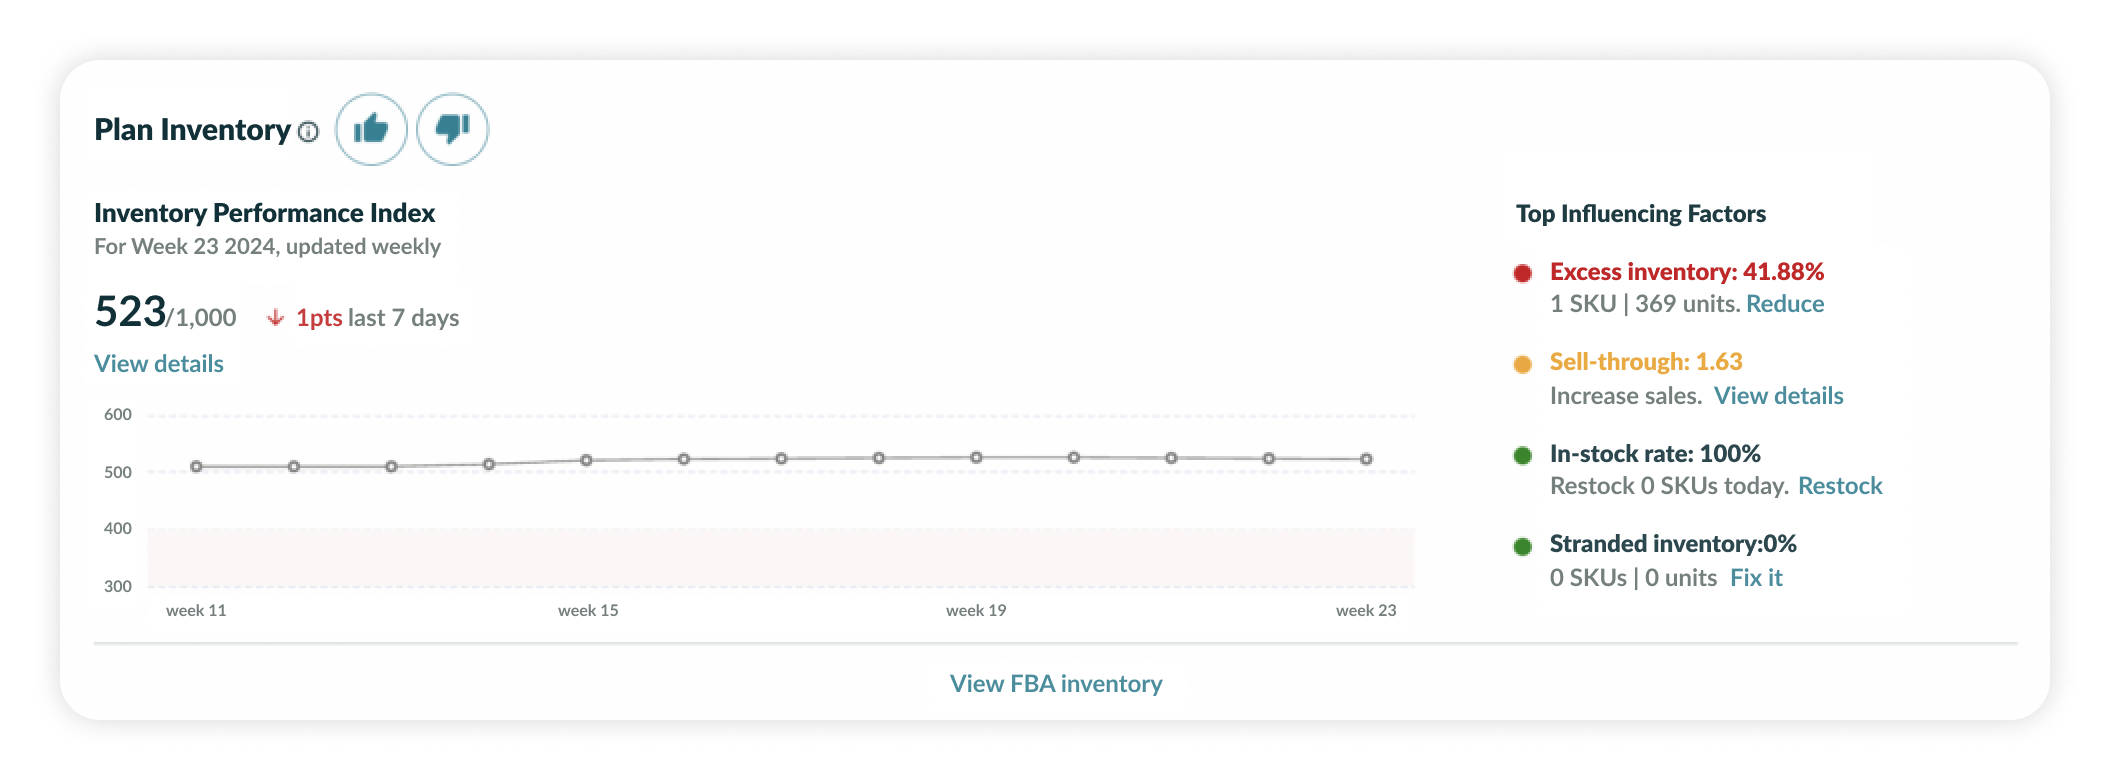
Inventory Performance Index (IPI): Amazon’s score for your inventory efficiency. A good IPI is over 400; if your score is lower than that, your account is at risk of suspension. Amazon provides a detailed graph to indicate areas in need of improvement.
Stockout Rate: Tracks how often you run out of stock, which can lead to negative reviews if customers can't get what they want.
Sell-Through Rate (STR): Measures how well you meet demand by comparing shipped units to total stock on-hand.
Recommended Removal: Identifies slow-selling items stored for over 365 days, suggesting items you might want to remove to avoid fees.
Inbound Performance: Assesses how accurately and timely your inventory is sent to FBA centers, factoring in proper quantity and packaging.
Monitoring these metrics consistently can help you streamline stock management and prevent costly inventory issues while ensuring customer satisfaction and compliance with Amazon’s standards.
#8 Fees Metrics
If you use Amazon FBA, it’s crucial to monitor your FBA fees, as they can take a big bite out of your profit margins. By tracking these fees, you can spot items that are too costly to store or sell via FBA (like oversized or slow-moving products), and adjust your inventory choices accordingly.
While Amazon does offer a calculator for FBA fees, it requires you to open a separate page and enter each product’s ASIN manually, which can be time-consuming. Consider using the AMZScout FBA fee calculator instead—it’s free, and works directly on the product page to provide quick insights.
Keep in mind that tracking additional metrics tailored to your business goals will provide a fuller picture of your performance. Reviewing these metrics regularly can help you stay informed and fine-tune your strategy as needed.
Conclusion
While Amazon metrics provide an overview for assessing your business, specialized tools can help you analyze identified gaps more thoroughly. Consider using the AMZScout toolkit to gain in-depth insights into competitor performance, track keyword effectiveness, and explore market trends. By combining these data sources, you'll refine and strengthen your strategy, allowing you to make more informed and effective decisions.
