How Does AMZScout Estimate Sales?

Many of our users seem to be wondering “How does AMZScout estimate product sales?” This is an excellent question! We are very happy to answer it since the level of accuracy of our product estimation is something we hold in the highest regard. To understand the basic process, keep reading this article; or if you are a visual person - watch this video:
A Few Years Ago and Today...
A few years ago e-commerce was quite different from what it is today. There were many different online stores selling different products. If you wanted to start a business selling a certain product, there was no way of knowing whether the product was selling well or not. The only way to know how well a product was doing was to contact the owner of the online shop and ask them directly…
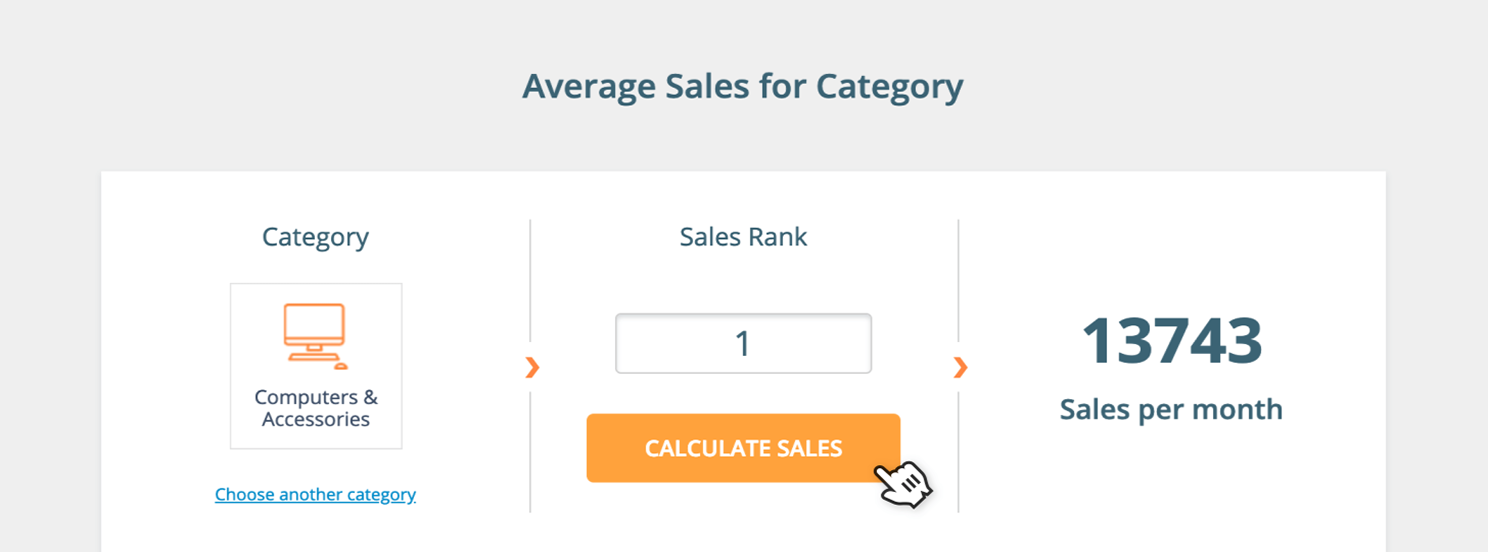
Today improved technology has made all the difference. Why? Because we have a global marketplace called Amazon that sells everything! Recently, it even launched an over-the-counter health products and live plants store! Amazon’s “Sales Rank” is an interesting and informative indicator which allows us to understand how successful a product is and in turn allows us to estimate its sales volume..
Amazon gives a higher rank to products that are selling well. The product that has the highest sales volume in its category receives rank #1. If it is not selling as well, it will be ranked #5, #10, #100… #1000 and so on. The lower the rank, the better.
Amazon does not give us any information about sales, but it displays the product rank. This allows us to make sales estimations.
The estimation process consists of the following steps:
1. We check the rank of each product.
2. We track some of the product inventory. Obviously, it is not possible to track all of the products because there are millions of them. (For example, we track the sales of #1 and #5).
3. We don’t know the sales of #2,3,4, but we are able to average this data using the sales of #1 and #5.
An Example of Estimation Process
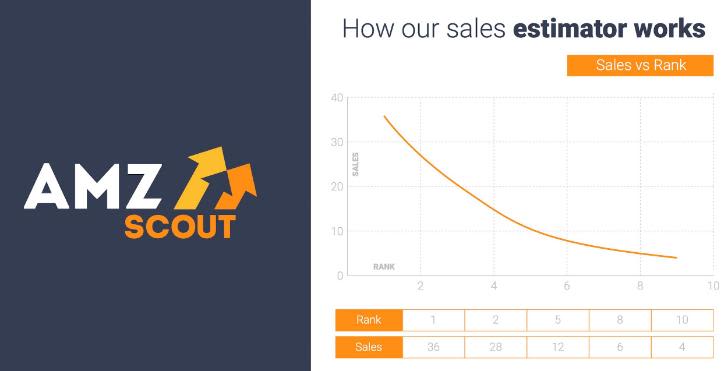
In this example, let’s suppose we know the exact sales for products with rank #1, #2, #5, #8 and #10. We don’t know the number of sales for #3, #4, #6, #7 and #9. Using the sales and rank data we can build the graph that is shown in the picture. Using this graph, it’s quite easy to estimate sales for products in question. So, for #3 sales are about 20, for #4 it is 15, for #6 it is 8 and so on.
It is important to note that this is an oversimplification of the process for the sake of illustrating how it works. In fact, we use data from a great number of points including data from real Amazon sales.
If a product doesn’t have a rank in a parental category, we estimate sales in subcategories. This is what gives our estimations that high degree of accuracy.


